Ð17Ð

Define Function:
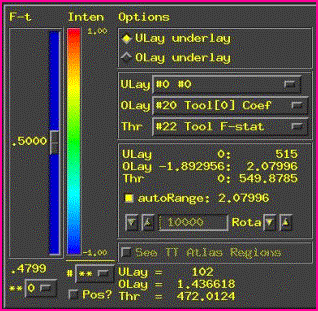
Color Overlay Panel
Color map
Hidden popup menu here
Choose which
dataset makes the underlay image
Choose which
sub-brick from Underlay dataset to display (usu. Anat - has only 1 sub-brick)
Choose which sub-brick of functional dataset makes the color
Choose which sub-brick of functional dataset is the Threshold
Shows ranges of data in Underlay and Overlay dataset
Shows automatic
range for color scaling
Rotates
color map
Lets you choose
range for color scaling
Threshold
slider
p-value of current threshold
Choose range of
threshold slider, in powers of 10
Positive-only or
both signs of function?
Number of panes in color map
Shows voxel values at focus
