3
•the
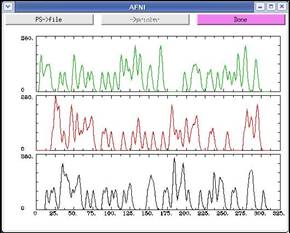
first curve (for wav.hrf.001.1.1D) is displayed on the bottom
•x-axis
covers 313 seconds, but the graph is extended to a more "round"
325
•y-axis
happens to reach 274.5, shortly after 3 consecutive type-2 stimuli
•the
peak value for a single curve can be set using the -peak option in waver
→default peak is 100
•it
is worth noting that there are no duplicate curves
•can
also use 'waver -one' to put the
curves on top of each other