Ð34Ð
Visualizing
the R Matrix

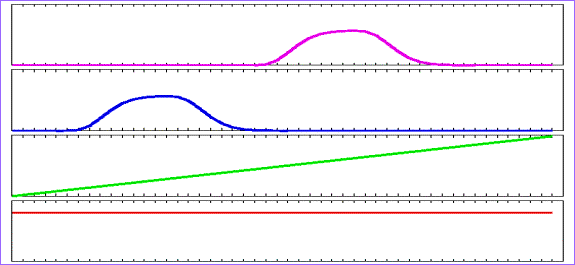
¥ Can graph columns, as shown below
¥ But might have
20-50 columns
¥ Can plot columns on a grayscale, as shown at right
¥ Easier to show
many columns
¥ In
this plot, darker bars means larger numbers


constant
baseline: column #1

linear
trend: column #2

response
to stim A: column #3

response
to stim B column #4