Hello afni team,
I have a question about the best way to analyze my fMRI data.
Now I have 3 runs and each run includes different condition separately (e.g. 1st run: high intensity stimulation/ 2nd run: low intensity stimulation/ 3rd run: finger movement). A simple block design was used for each run ((3TRs: stimulus + 7TRs: rest) * 10).
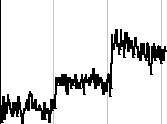
Before processing the data, I concatenated 3 runs into one big functional data file and then used the concatenated data with mprage to do preprocessing. Everything worked fine but when I looked at the time series from ROIs, I have found that the initial time series for each run was different from each other. For example, the overall time series in the 1st run seemed lower than other two runs (2nd and 3rd. please see the attached file). Even I've included the normalization step (scale), it seems like all the time series did not scale to have a mean of 100. Do you have any suggestions on this?
Thank you!
Taek
Attachments:
open |
download -
timeseries_example.png
(4.8 KB)


