Hello,
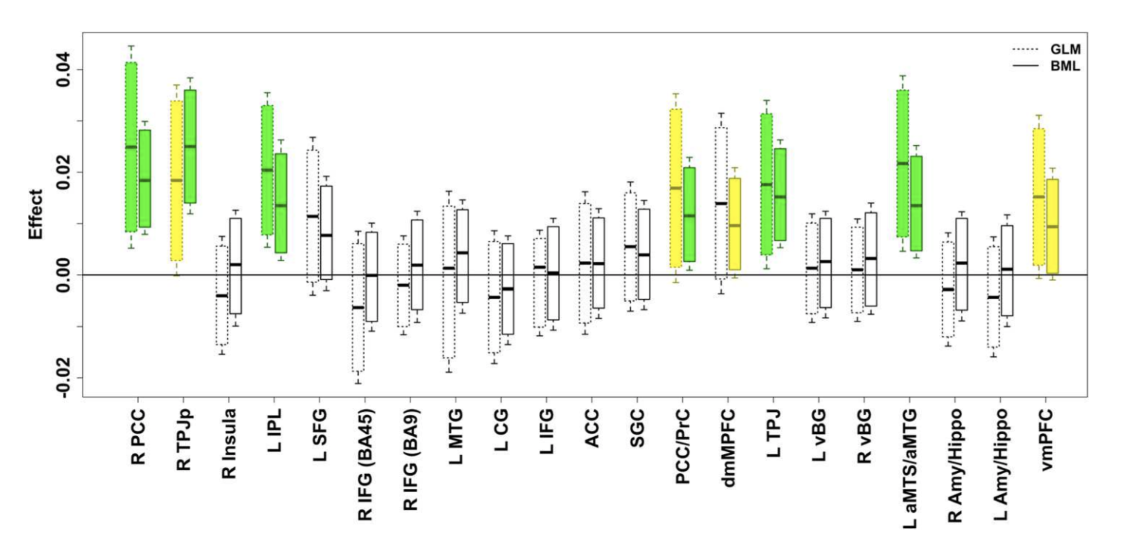
I have recently run an RBA analysis on regions of interest and would like to create a boxplot similar to Chen et al., 2019 to report the effects for each region. I am completely new to R so any guidance is appreciated.
Cheers,
Gerome
Attachments:
open |
download -
Screen Shot 2019-12-16 at 9.53.38 AM.png
(284.8 KB)


