Hi pt,
Thank you (always) for your help and quick response.
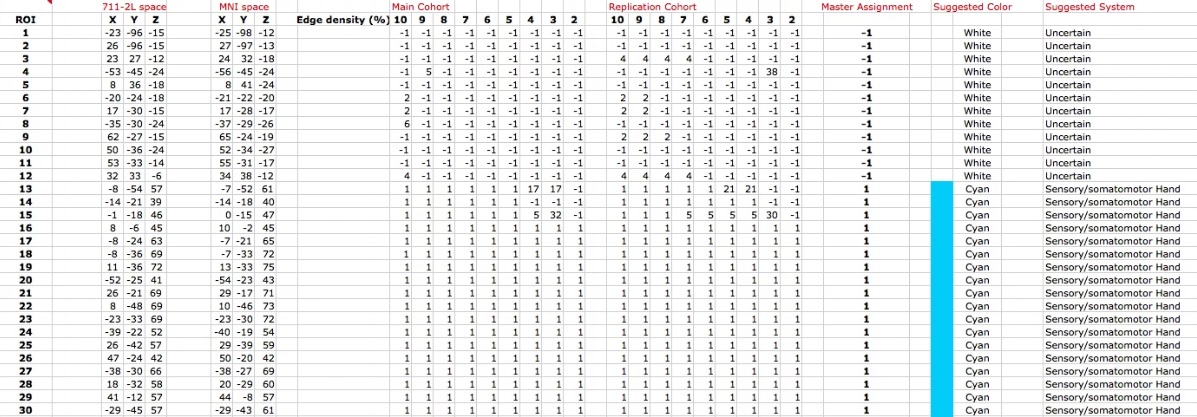
Yes, the txt file has 3 columns (x-, y- and z-coord values). Could you clarify what should be the 'ROI value' in the 4th column? I attached a screenshot of Power et al. (2011)'s coordinate excel file. The 4th column should be the Master Assignment column that divides the coordinates into each network (e.g., DMN, DAN etc)? Would you suggest that the txt file should look like below (I just put some random numbers)?
x y z network
10 20 30 1
5 15 25 2
.
.
.
I didn't see the warning message though. Below is the message that appeared when running the 3dNetCorr.
++ Reading in.
++ Allocating...
++ User didn't enter mask: will make my own, based on where I find nonzero time series.
++ Applying mask to ROIs.
++ Labelling regions internally.
++ No refset labeltable for naming things.
++ Getting volumes.
++ Calculating average time series.
++ Calculating correlation matrix.
++ Writing output: subj.netcorr ...
3.492u 0.615s 0:04.16 98.5% 0+0k 0+2io 29pf+0w
Best,
JW


