11.2.2. Rest FMRI processing: the MACAQUE_DEMO_REST
Overview
Welcome to the homepage of the demo for processing resting state FMRI macaque data.
The demo dataset contains data from six subjects from three different sites, with each dataset available from the public PRIME-DE resource:
sub-01, sub-02, sub-03: Messinger (NIMH, NIH, USA)
sub-032222, sub-032223: Klink and Roelfsema (Netherlands Institute for Neuroscience, Netherlands)
sub-032309: from Procyk, Wilson and Amiez (Stem Cell and Brain Research Institute, France)
Thanks to all of them for collecting+providing this data publicly.
For each subject, there is one anatomical and two EPI/FMRI datasets. Some datasets here were acquired from anaesthetized macaques, some were awake. Some macaques had MION contrast present. Some macaques moved a lot during scanning. Some data are fairly distorted, have large signal base variation across scans, have dropout due to objects in the scanner, etc. In some cases the FOV does not contain the entire brain. Therefore, there are a wide variety of features to examine and look for in the QC stages. There is a README.txt in the data_00_basic/ directory for each subject that describes a bit more about each, but more information is also present on the PRIME-DE website.
The processing scripts include calculating nonlinear alignment between
the subject’s anatomical using AFNI’s @animal_warper and the
NMT v2.0 template. Additionally, a
full single subject processing pipeline is constructed with
afni_proc.py—actually, there are two such commands provide for
parallel usage: one for “voxelwise” processing (because it includes
spatial smoothing) and one for “ROI-based” analyses (no smoothing
involved). Additionally, there is an example of using 3dNetCorr
to calculate correlation matrices for the latter, using the new
CHARM atlases for the macaque.
These scripts are meant to providing and example and starting point of task processing. Many features can (and, in general, will) be adjusted for your own study’s design. Please feel free to ask question on the AFNI Message Board, even with regards to setting up your study.
Thanks go to Adam Messinger, Ben Jung and Jakob Seidlitz for both the accompanying macaque data set and many processing suggestions/advice.
Download the MACAQUE_DEMO
To get the demo, copy+paste:
@Install_MACAQUE_DEMO_REST
This will both download and unpack the demo in the directory where the command is run.
There is a README.txt describing the contents.
Demo contents
Input datasets
The demo contains one subject’s initial data:
a standard, high-res anatomical (T1w) dataset
two resting state FMRI (EPI) datasets; these are raw EPIs. Note that some were acquired on anaesthetized macaques, and some macaques had MION contrast present during their resting state scan.
Again, these data were acquired at different sites with very different
parameters and conditions. Some of the coordinate axes of the
downloaded data were odd, and the dsets were recentered to have the
coordinate origin (x, y, z) = (0, 0, 0) be in a reasonable spot
somewhat central in the brain. Additionally, some EPIs did not
overlay the anatomicals at all, and recentering helped make this more
reasonable to start with. Any such commands used are recorded in the
README.txt files in a subject’s directory in data_00_basic/.
On a minor note, all “float” dsets were converted to “shorts” to be smaller both for download and future processing (with negligible rounding error, since most dset values were of order 1000 or greater).
There is a scripts/ directory with the main processing commands in
a single do_all.tcsh script. This processing script is commented,
describing many choices of processing parameters. There is also a
main README.txt file describing the processing.
The (symmetric) NMT v2 templates and associated atlases should also be downloaded automatically when you download+install the Demo.
Because there are 6 subjects included in this Demo, we do not include
any processed data. You will have to run the do_all.tcsh script
to see the full outputs of command. However, we do distribute the
QC*/ directories of images and HTML output for processing steps,
as well as the images of the final correlation matrices.
Processing: nonlinear alignment with @animal_warper
AFNI’s @animal_warper command is used to process the anatomical of
each subject. This performs both skullstripping and nonlinear
alignment to template space (here, the stereotaxic NMT v2 template).
Additionally, atlases in the standard space are warped to native
anatomical space, as well as tissue maps and the template brain mask.
Surfaces were also generated automatically, with viewer scripts output
to show them in SUMA.
This command was run as part of the included do_all.tcsh script.
Using 6 cores/threads/CPUs on a laptop, this part of the processing
took about 30 mins to run for each subject.
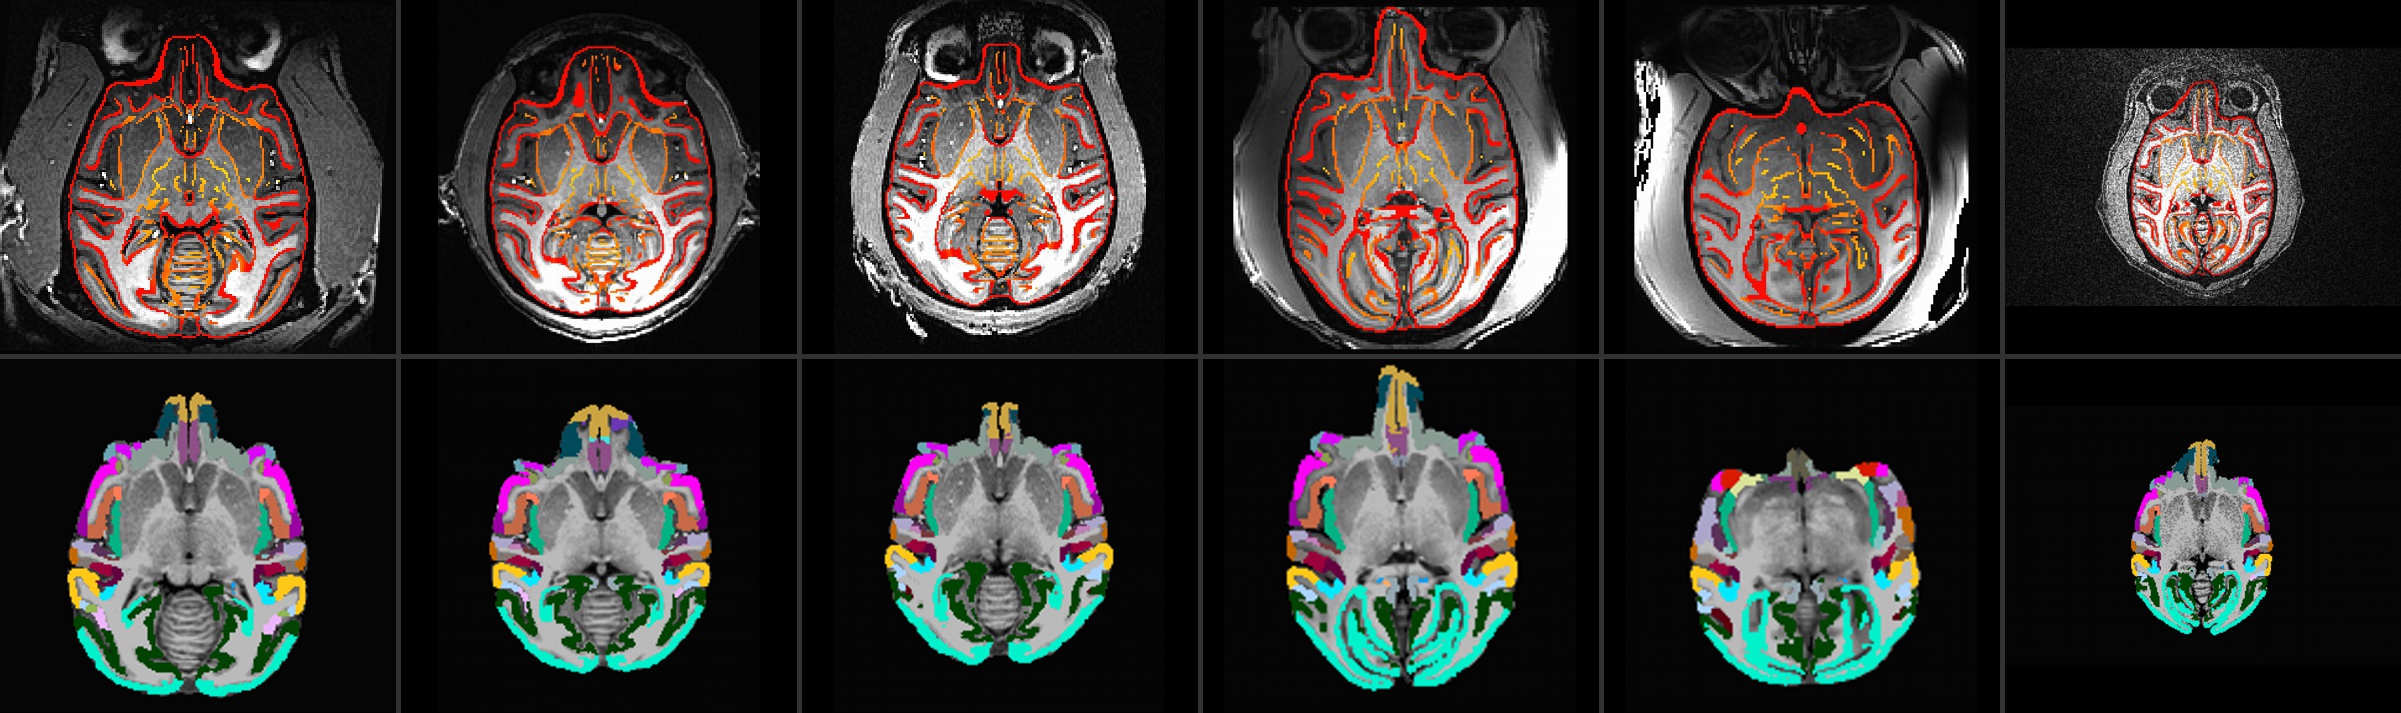
Some of the functionality and output of this step can be seen in the
automatically generated QC images in the QC_data_01_aw data for
each subject.
Top: ulay = native anatomical; olay = edges of aligned template
Bottom: ulay = skullstripped, native anatomical; olay = CHARM
level 5 atlas ROIs (olay) mapped to native space
|
|---|
|
Details of QC outputs showing alignment, skullstripping, ROI mapping and surface viewing of ROIs |
|---|
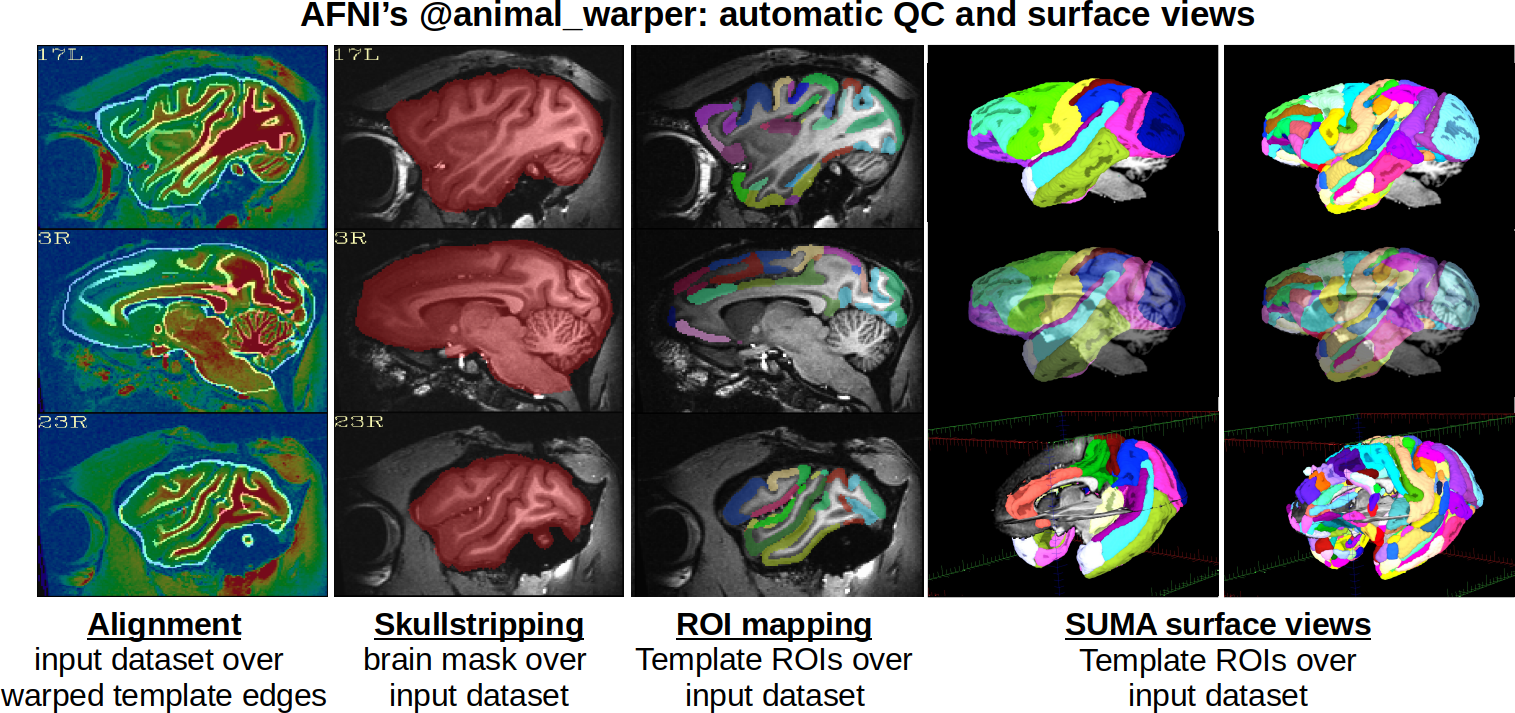
|
Outputs from this step are included as inputs for afni_proc.py.
Processing: full single subject preprocessing with afni_proc.py
A full preprocessing script for each subject, including motion
correction and regression modeling, is generated using
afni_proc.py. Actually, there are two versions of the
afni_proc.py command to be run: one with no smoothing, which would
be useful for ROI-based analyses; and one with smoothing, which is
typically used in voxelwise analyses. Each command is run in
parallel/independently, and is contained the main do_all.tcsh
script.
In this example, each subject has 2 EPI datasets. Again, there is a wide variety of acquisition parameter and study design (awake/asleep, without/without contrast agent, etc.), as well as relative distortion and dataset quality. Some subjects contain so much motion they would likely be excluded from group analysis. Each subject was processed the same and the final outputs are at one resolution (1.25 mm isotropic voxels), but there are several considerations and parameters you might consider adjusting in your own studies.
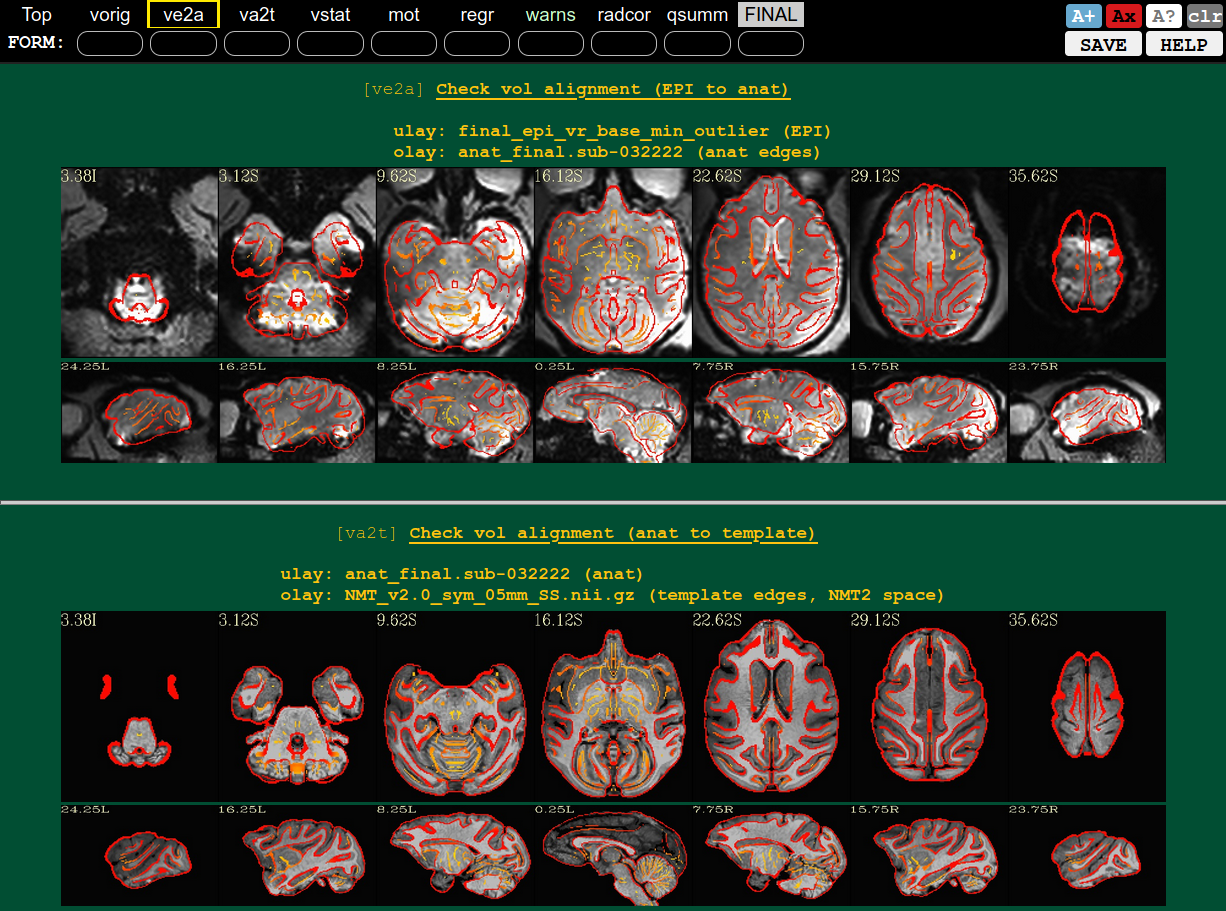
The outputs of the the afni_proc.py-generated scripts are not
included, but their automatically generated QC HTML files are. Some
example sections of these from various subjects are included below.
QC blocks: alignment of EPI-to-anat (ve2a) and anat-to-template (va2t) |
QC block: some stats check using seedbased correlation (vstat), from visual and auditory locations |
|---|---|
|
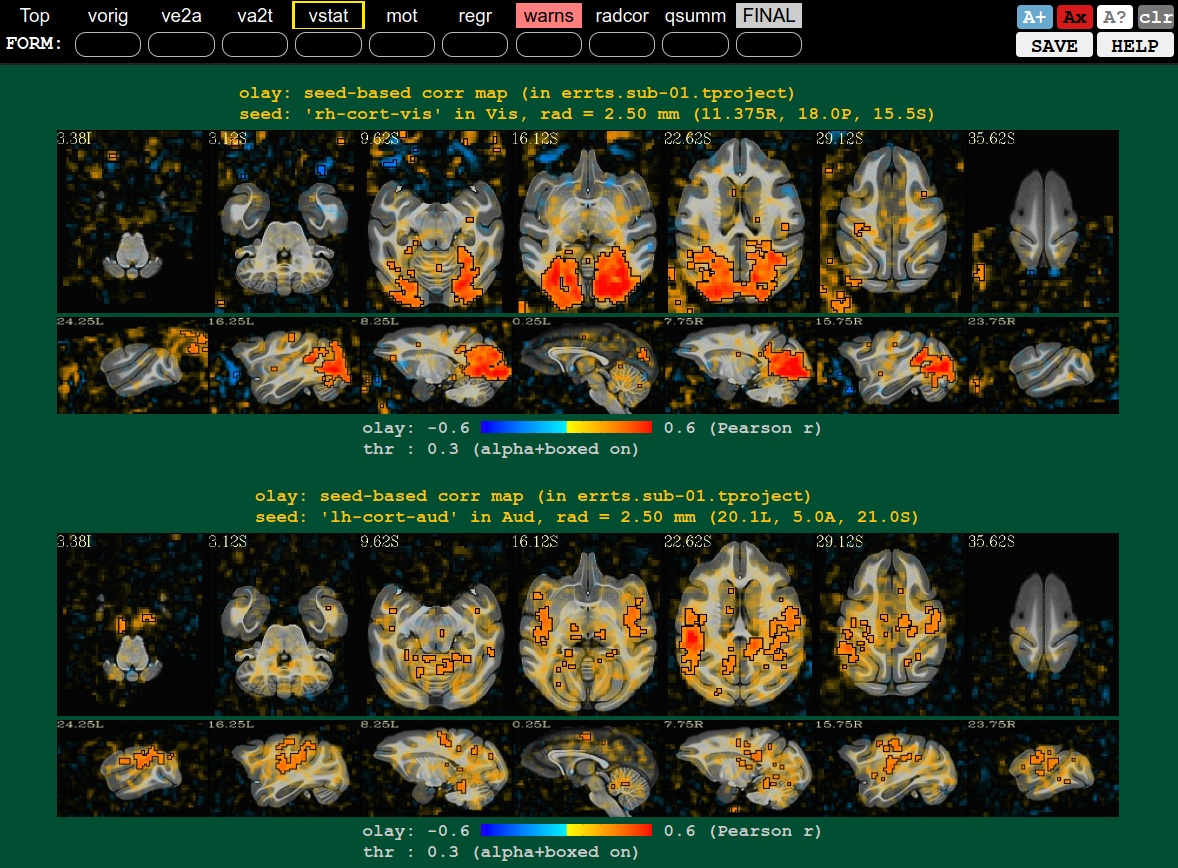
|
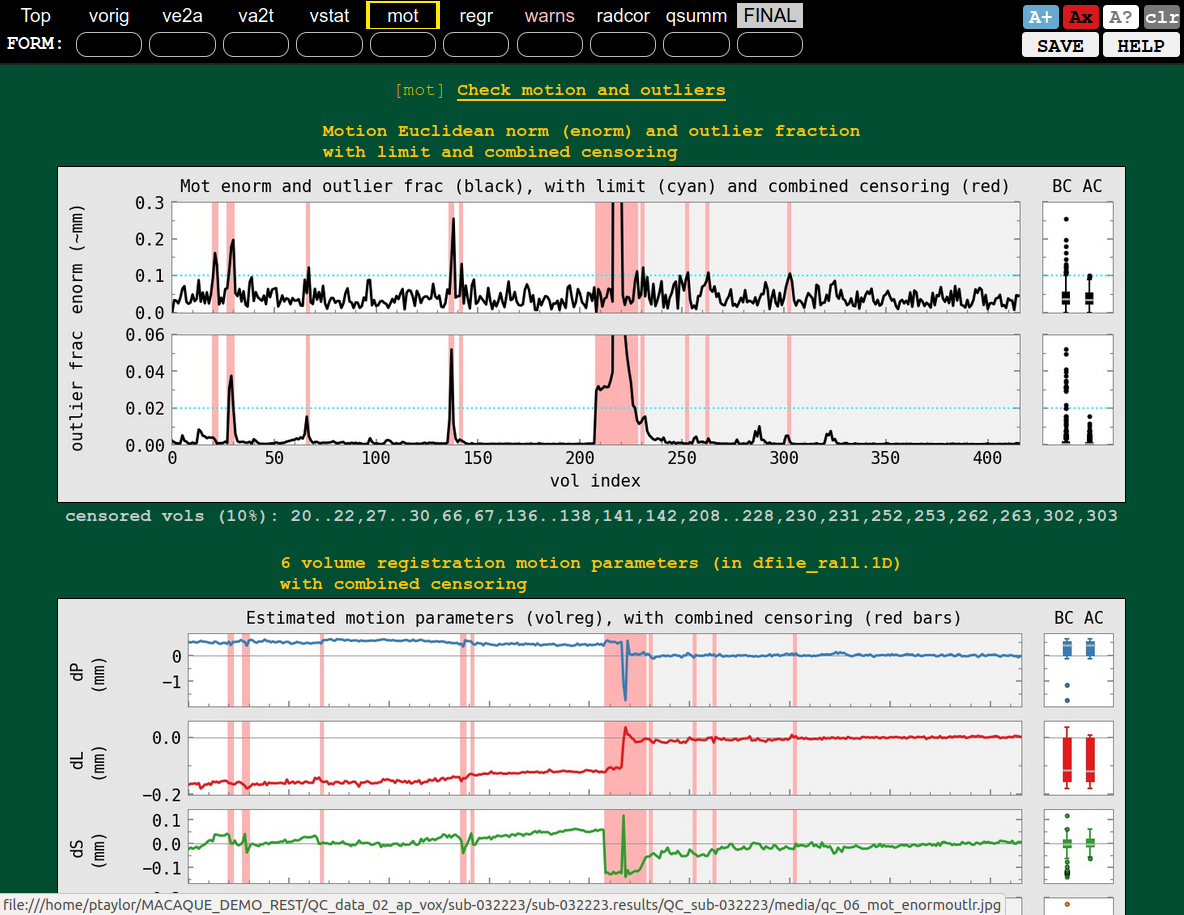
QC block: motion check (mot), probably not too bad |
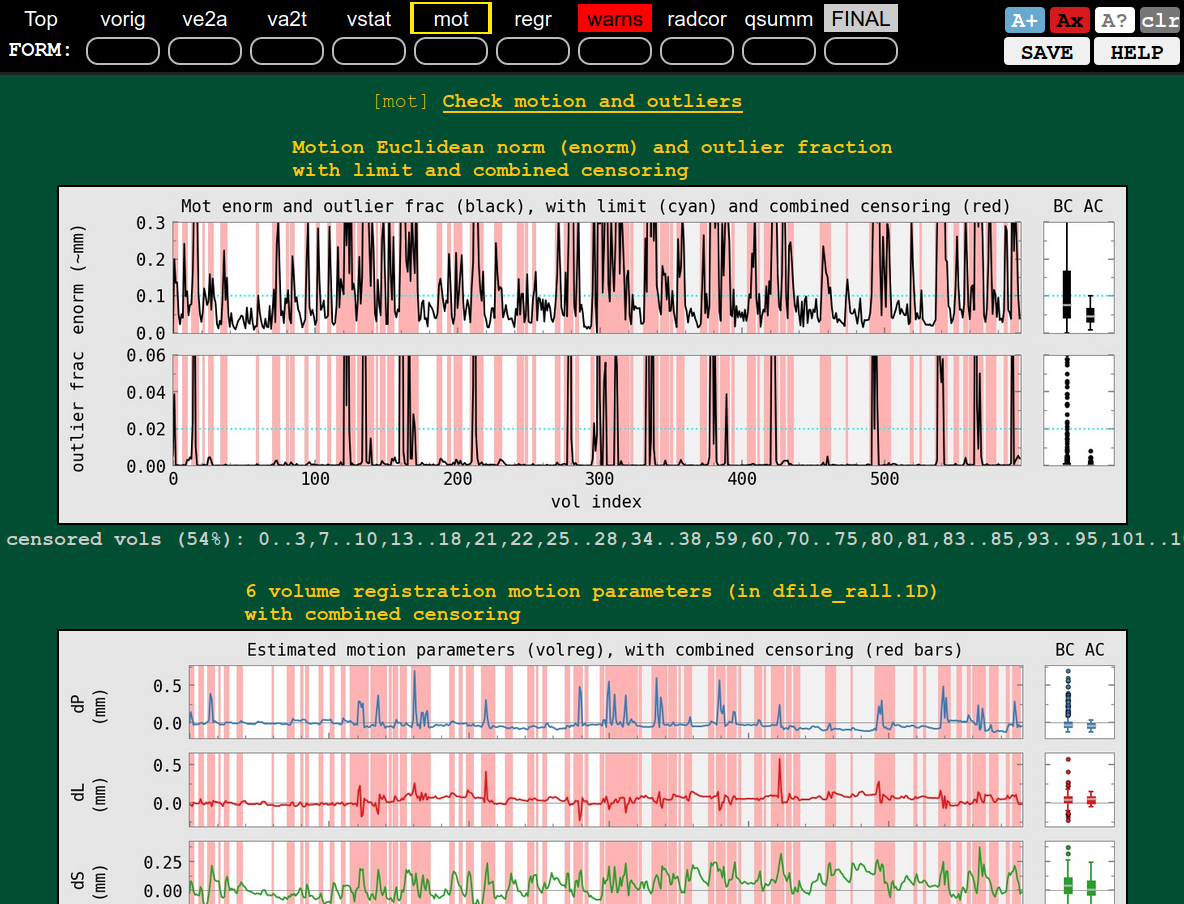
QC block: motion check (mot), whoooa, pretty sizeable and flagged in ‘warns’ block |
|---|---|
|
|
Processing: Correlation matrices via 3dNetCorr
Using the outputs of afni_proc.py that did not include smoothing,
we conduct a simple ROI-based analysis.
3dNetCorr was run to calculate correlation matrices for each
subject, using both the CHARM (for each level 1-6) and D99 atlases.
Both the Pearson r and Fisher-transformed Z values were calculated,
and then plotted using fat_mat2d_plot.py. All the matrices are
included in the Demo in the QC_data_03_postproc/ directory (SVG
format is convenient for showing these, so one can zoom in and read
the matrices that have looots of ROIs and therefore tiiiiny fonts at
standard display size).
We show a few example matrices here. Note that no global signal regression (GSR) was included in the processing, so the matrices don’t include that layer of shifting/reorganization.
Correlation matrices (Pearson r) for the CHARM |
Levels 1-6 in increasing order (left->right and top->down) |
|---|---|

|

|

|

|

|

|
Correlation matrices (Pearson r) for the D99 atlas |
|
|---|---|

|
