10.4. India Brain Template (IBT)
10.4.1. Overview
Here we present the India Brain Templates (IBTs). This is a set of
anatomical group templates and atlases from  subjects
from many states around India, scanned at several different sites (all
3T scanners).
subjects
from many states around India, scanned at several different sites (all
3T scanners).
There are five sets of templates and atlases, covering a lifespan range from 6-60 years, in the following cohort groupings:
C1: 6-11 yrs (late childhood),
 , 46% female
C2: 12-18 yrs (adolescence),
 , 47% female
C3: 19-25 yrs (young adulthood),
 , 41% female
C4: 26-40 yrs (adulthood),
 , 43% female
C5: 41-60 yrs (late adulthood),
 , 44% female
For more details on demographics and acquisition, please see the publication, below.
Contents
For each of the above cohorts, there are multiple template and atlas datasets.
Each template is a T1-weighted (T1w) anatomical volume. There is both
a group average template and a “typical” single subject version. The
group average template was through multiple iterations of alignment
among all the cohort subjects, with increasing refinement (via rigid,
then linear affine, and then several nonlinear warping stages). This
procedure was performed using the new make_template_daskpy tool in
AFNI, which utilizes Python task scheduler Dask
to coordinate the jobs within and between levels, managing the
resources efficiently whether on a cluster or a desktop computer. The
“typical” subject version of the template is the individual anatomical
aligned to the group mean template with the minimal cost function
value (i.e., the brain that appears to have the best match to the
final mean template), providing a particularly high tissue-contrast
version of the template.
Each atlas was derived from FreeSurfer parcellations. There are atlases made from each of the “2000” and “2009” parcellations from standard FreeSurfer output. Each of those is presented in two forms: a maximum probability map (MPM), which corresponds to the group average template, and the “typical” subject atlas, which corresponds to the “typical” subject template.
An example of the contents in the IBT download for each cohort is provided here:
IBT contents |
Description |
|---|---|
ibt_C1_template_mean.nii.gz |
group mean template |
ibt_C1_template_mean_mask.nii.gz |
binary mask of group mean template |
ibt_C1_template_typ.nii.gz |
“typical” subject template |
ibt_C1_template_typ_mask.nii.gz |
binary mask of “typical” subject template |
ibt_C1_atlas_mpm_fs2000.nii.gz |
maximum probability map (MPM) atlas from FreeSurfer’s “2000” parcellation; corresponds with group mean template |
ibt_C1_atlas_mpm_fs2009.nii.gz |
maximum probability map (MPM) atlas from FreeSurfer’s “2009” parcellation; corresponds with group mean template |
ibt_C1_atlas_typ_fs2000.nii.gz |
single-subject atlas from FreeSurfer’s “2000” parcellation; corresponds with “typical” template |
ibt_C1_atlas_typ_fs2009.nii.gz |
single-subject atlas from FreeSurfer’s “2009” parcellation; corresponds with “typical” template |
supplementary_C1/ |
a directory of supplementary datasets. 1) Tissue-based maps of subsets of each atlas: GM, GM ROIs (i.e., not including unspecified cortical GM, useful for tracking or correlation matrices), WM, CSF, Ventricles, “other” (such as “optic chiasm”), and “unknown”. 2) Segmentation maps: 1=GM, 2=WM, 3=CSF+Vent, 4=other+unknown. |
Example images
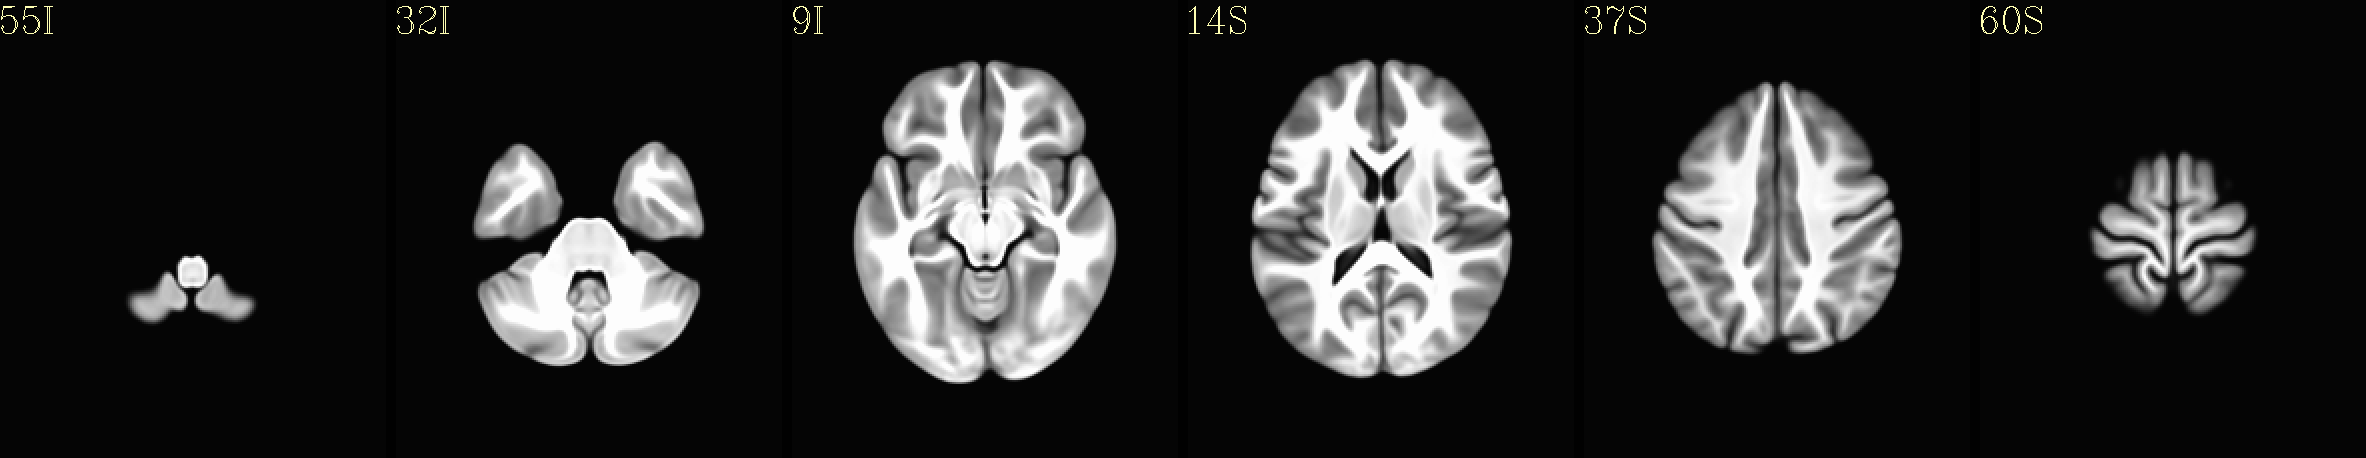
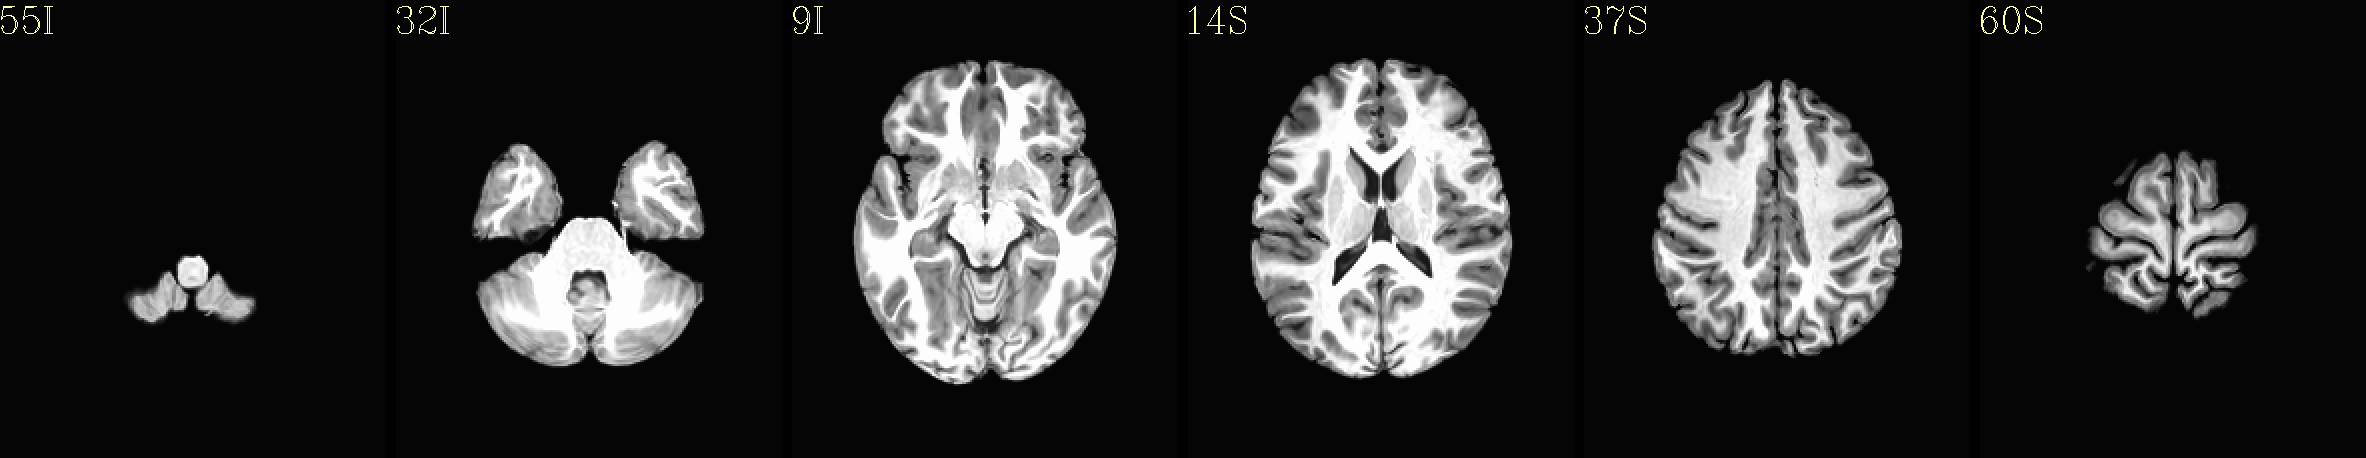
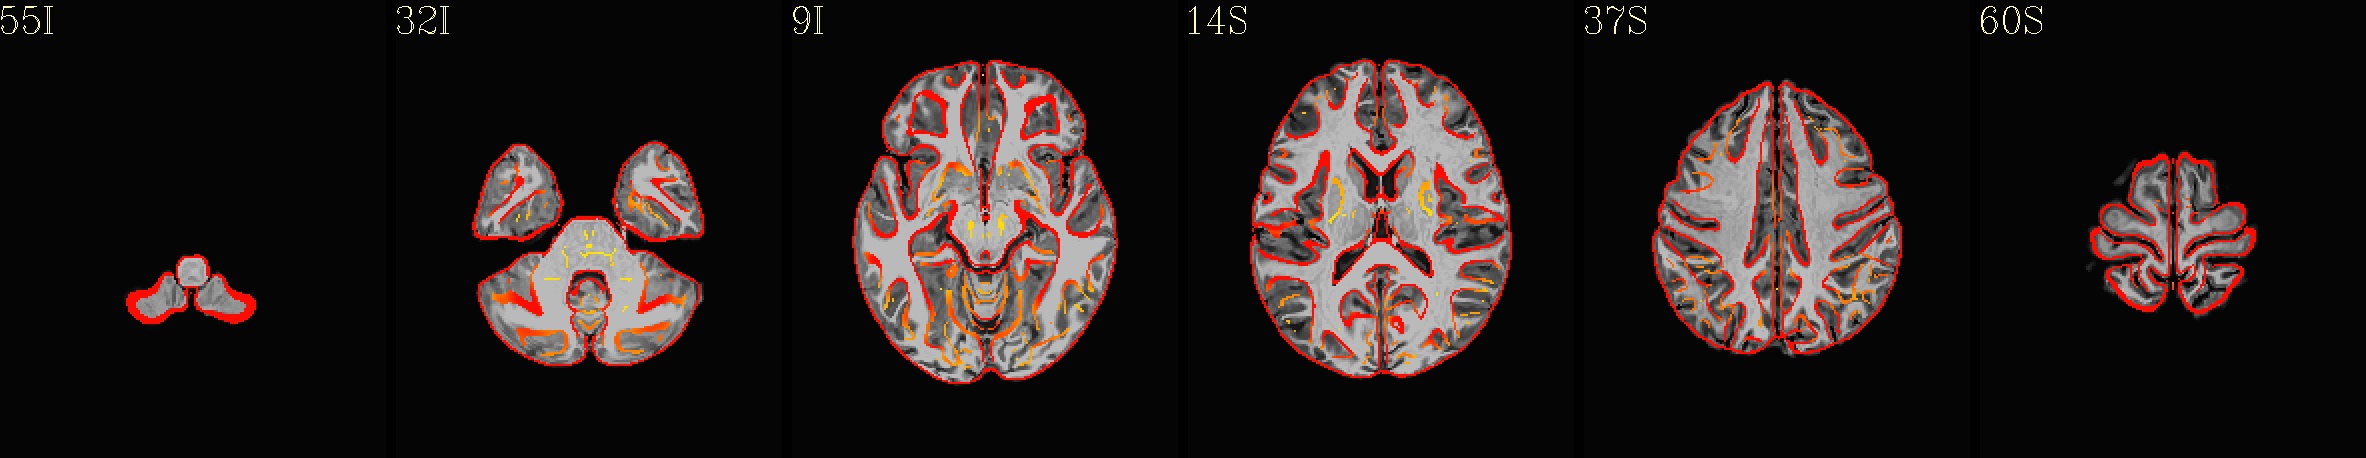
Here are some example images from the IBT download, using just the C3 cohort (equivalent images exist for each of the five cohorts):
Axial montages (from top to bottom): group mean template, “typical” subject template, and edges of group mean template over the “typical” subject template |
|---|
|
|
|
The script used to make these images with ``@chauffeur_afni`` is
available here: do_00_view_ibt_templates.tcsh.
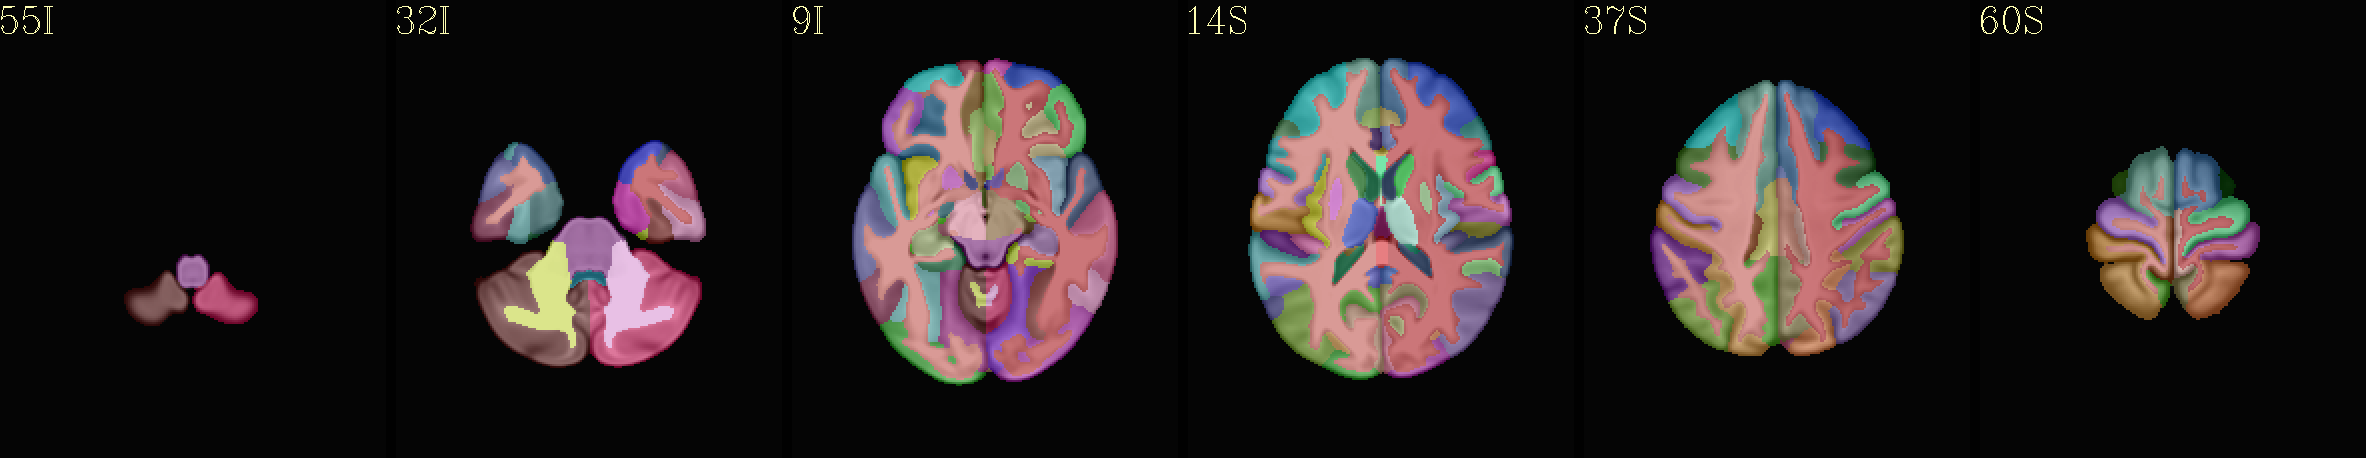
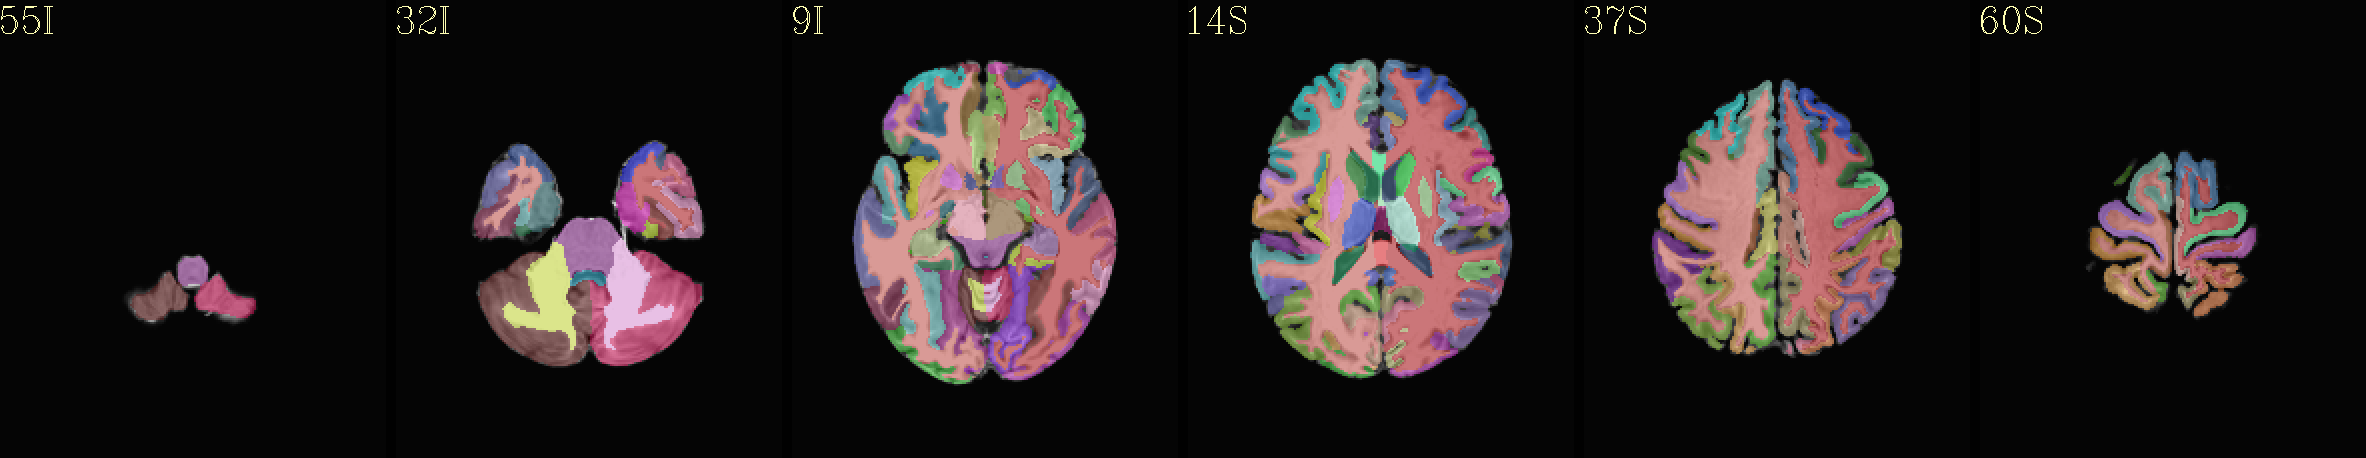
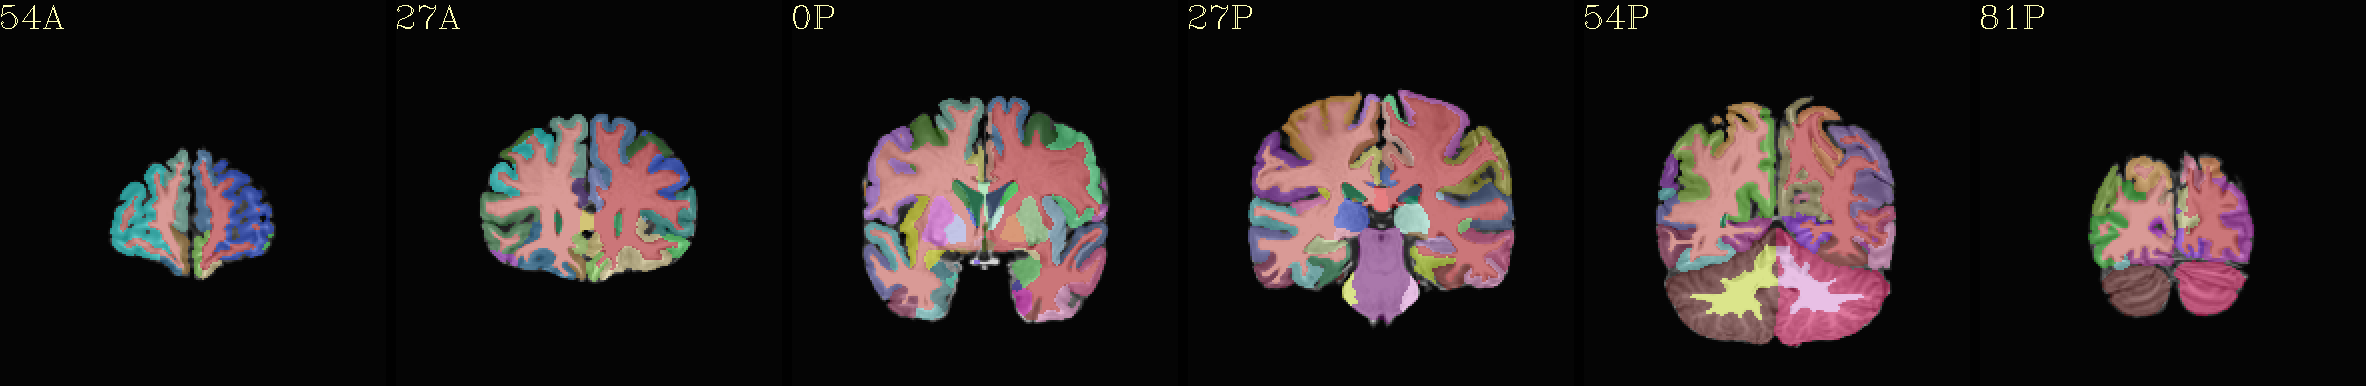
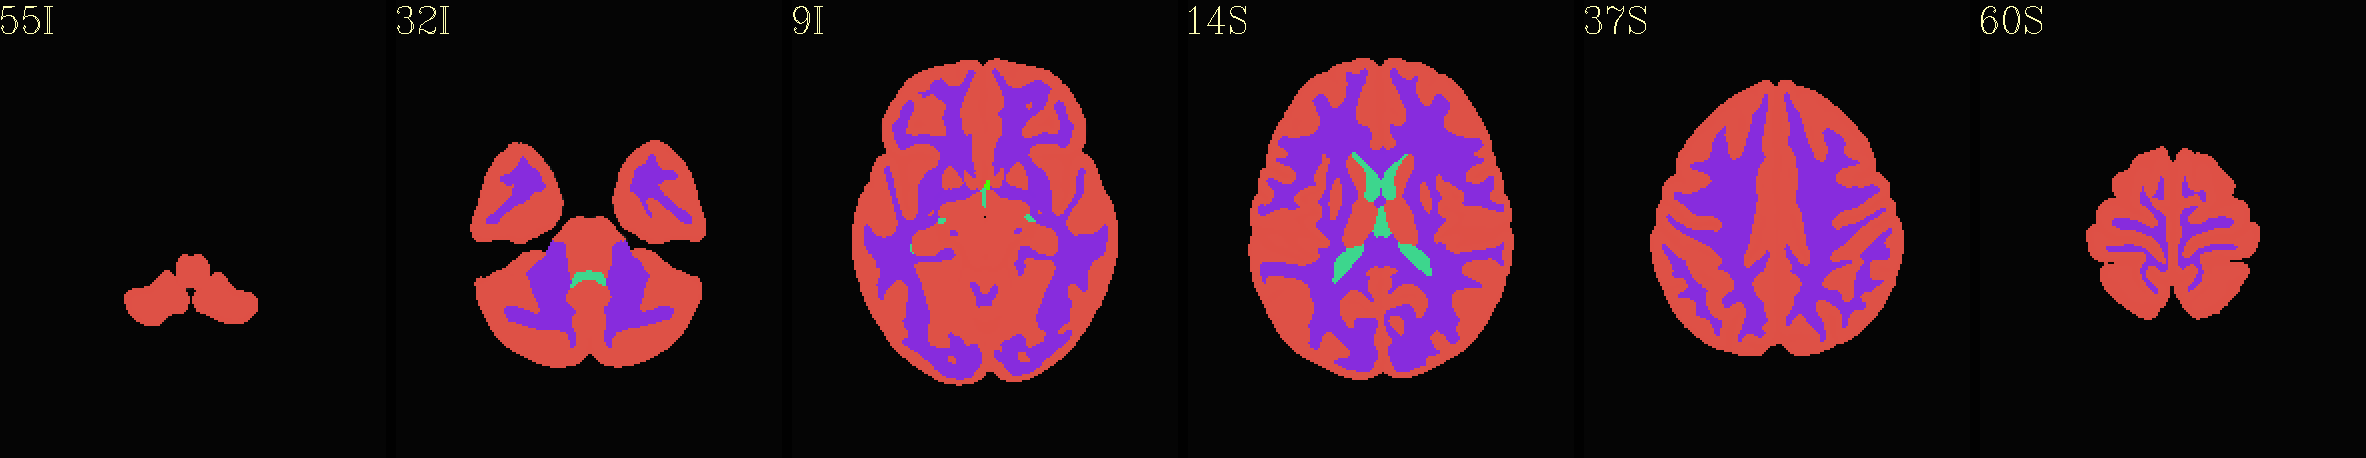
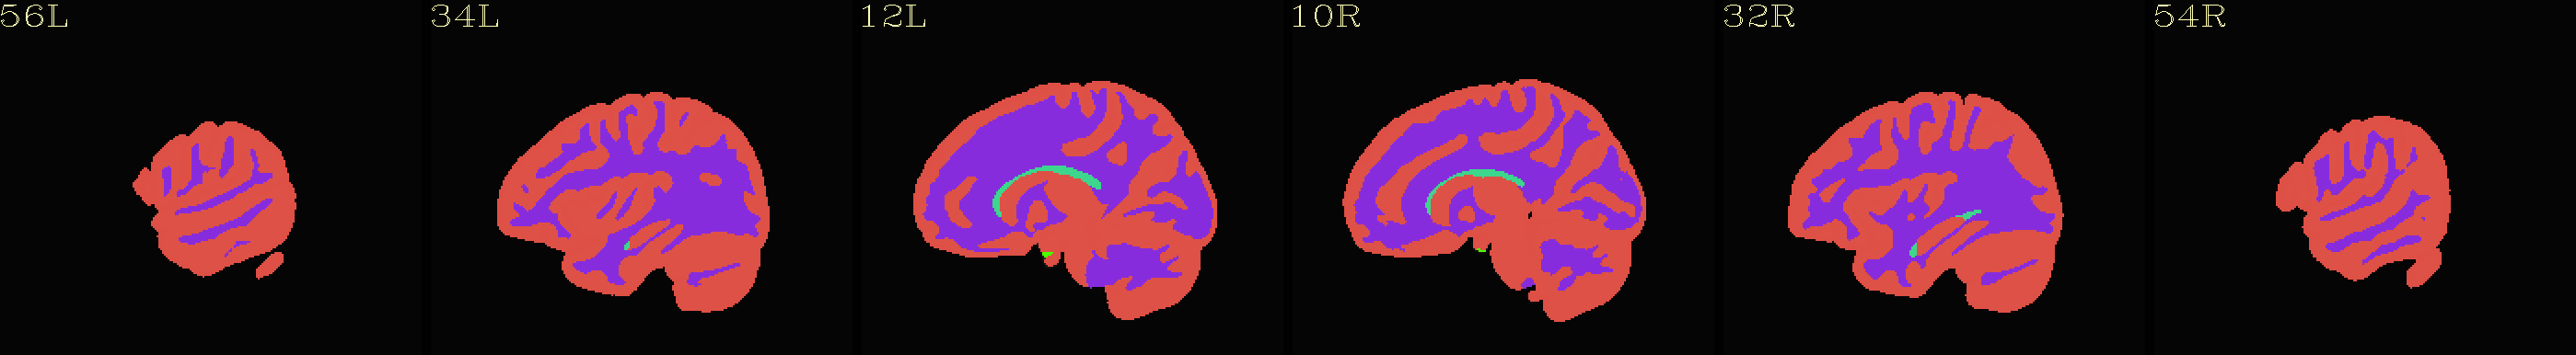
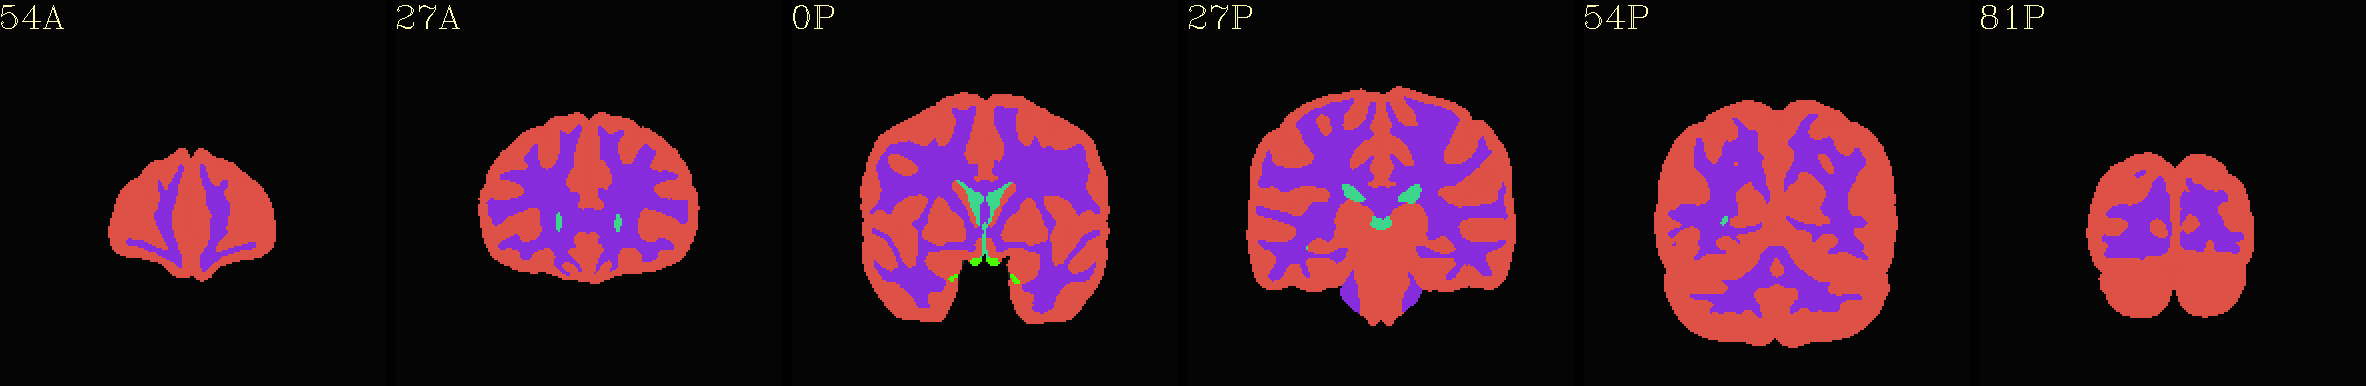
MPM “2000” atlas overlaid translucently on group mean template |
|---|
|
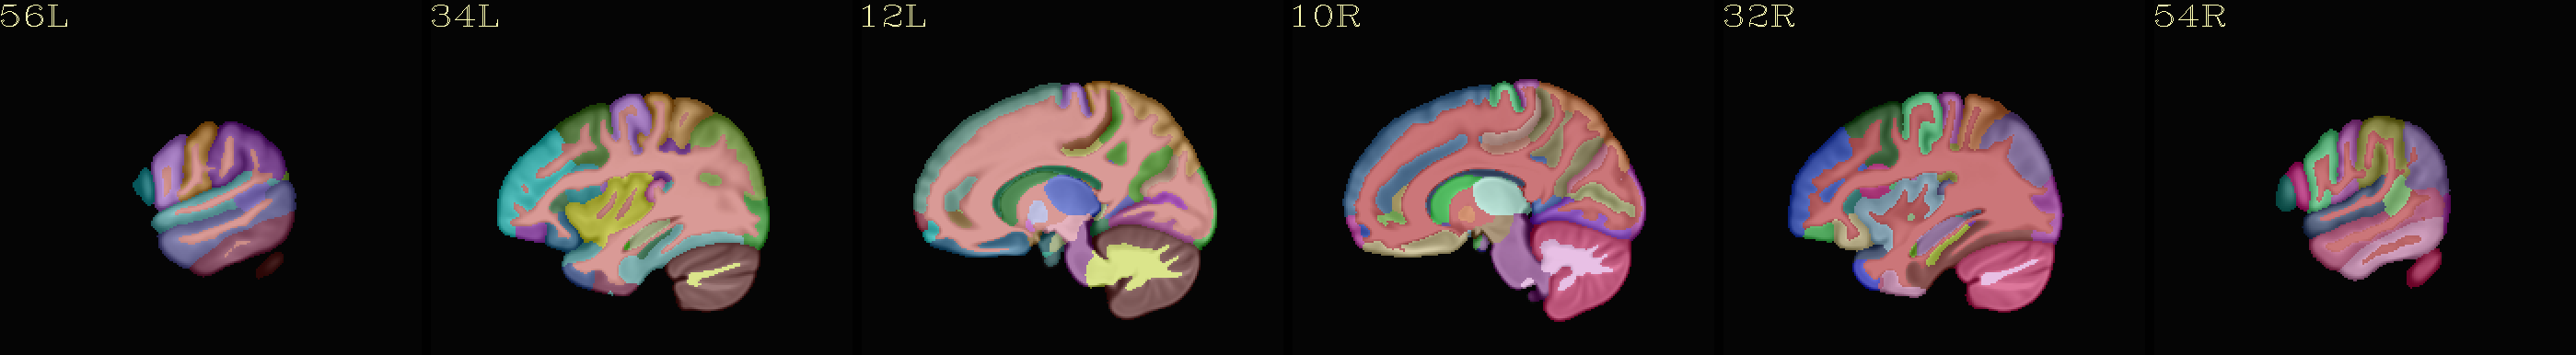
|
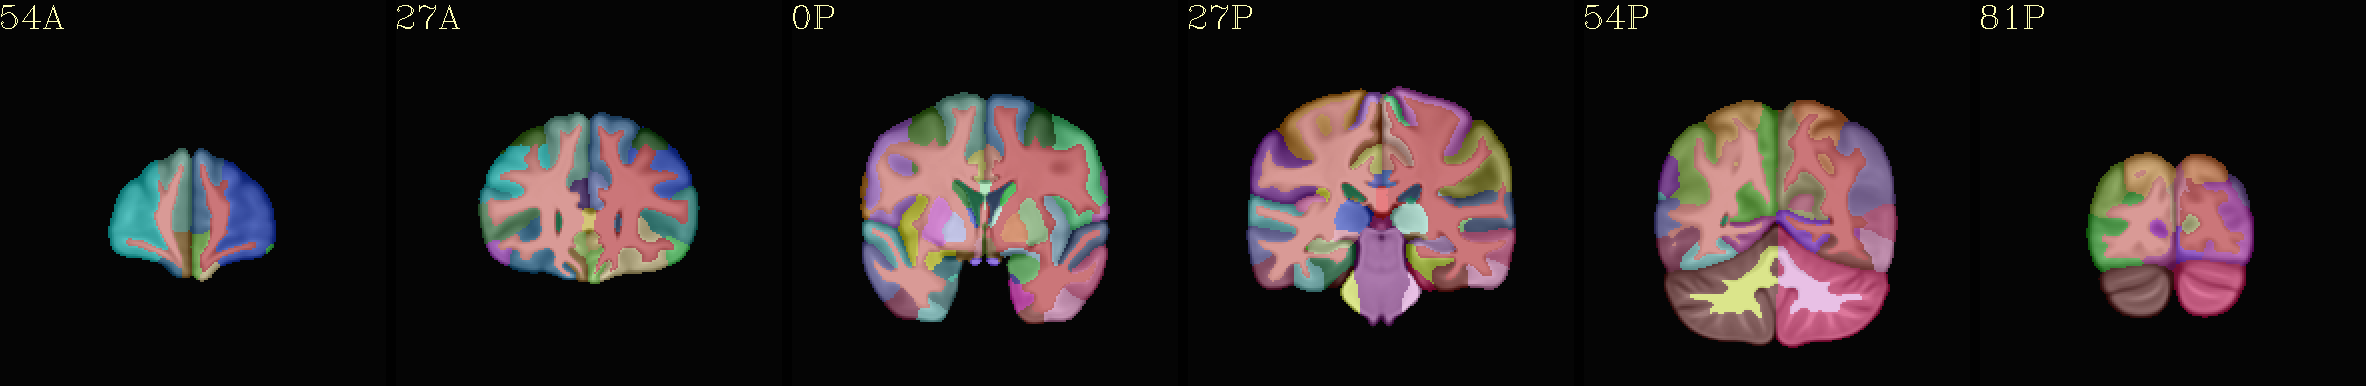
|
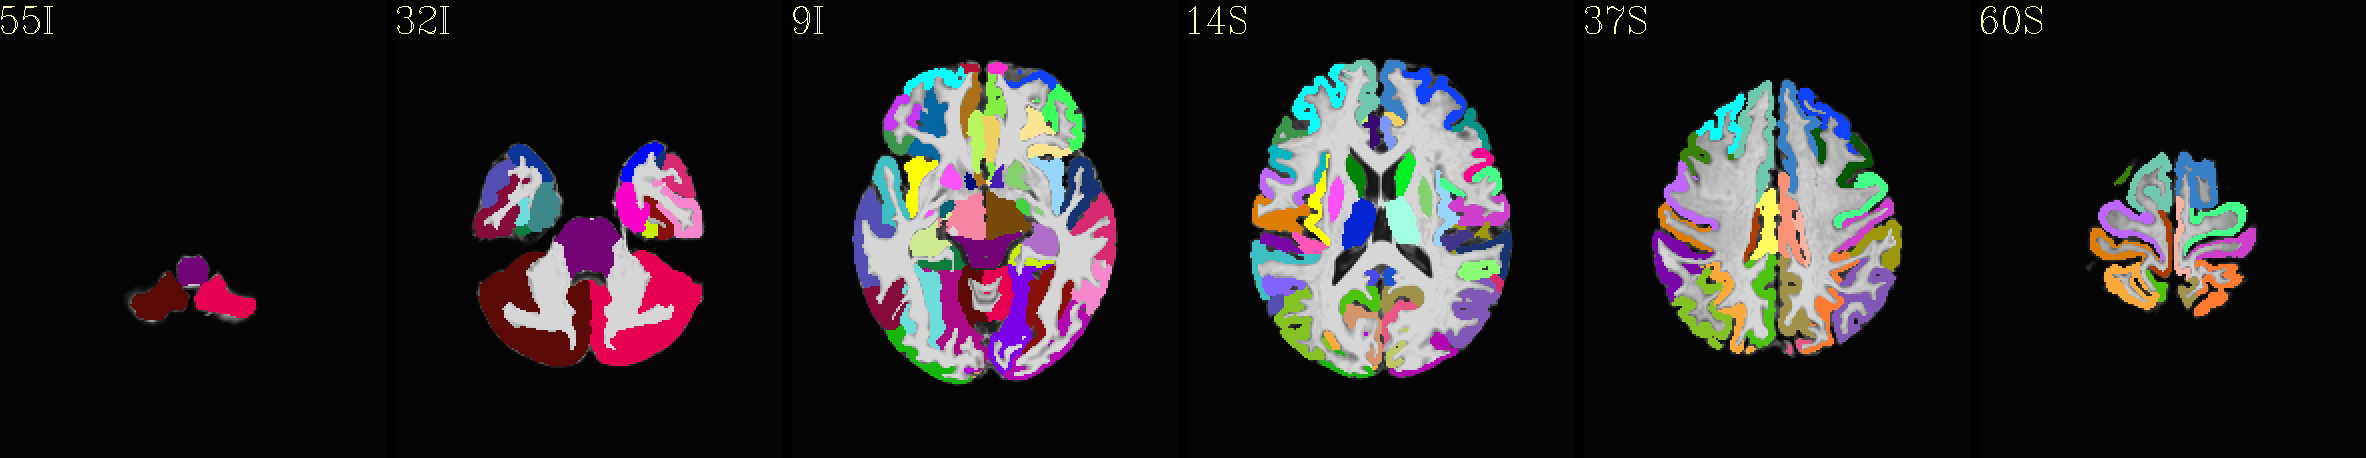
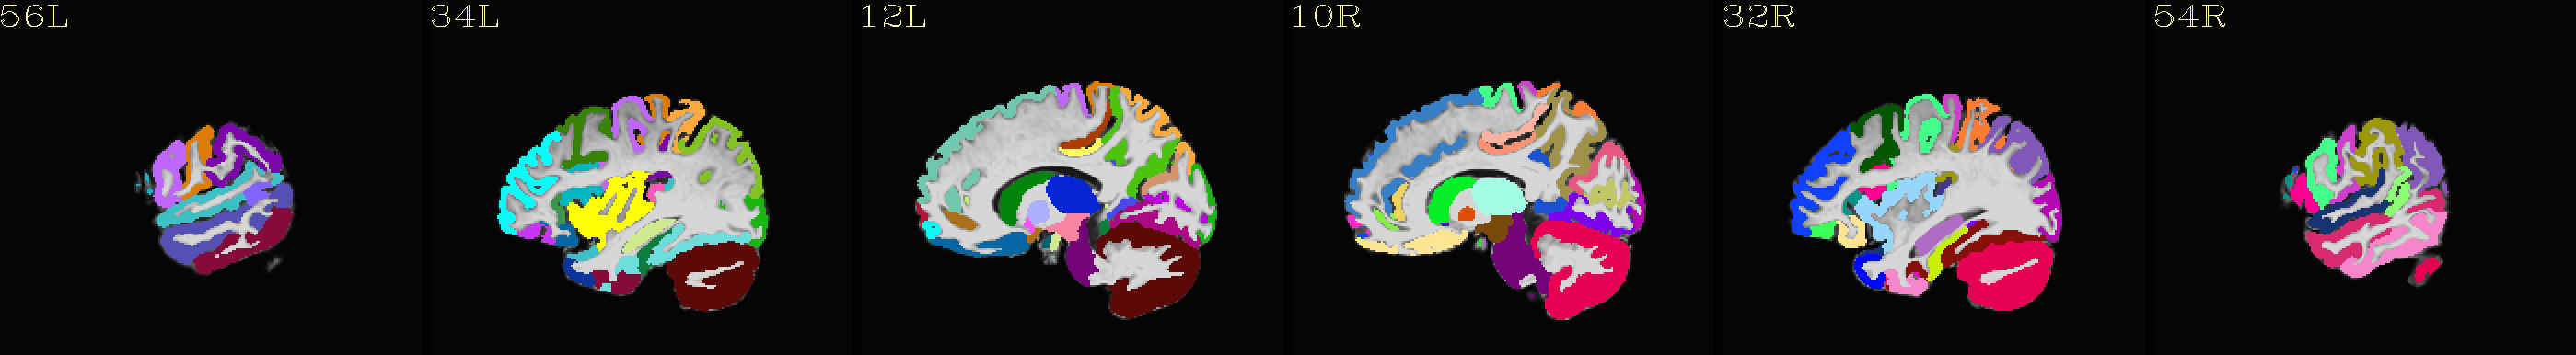
Individual “2000” atlas overlaid translucently on “typical” template |
|---|
|
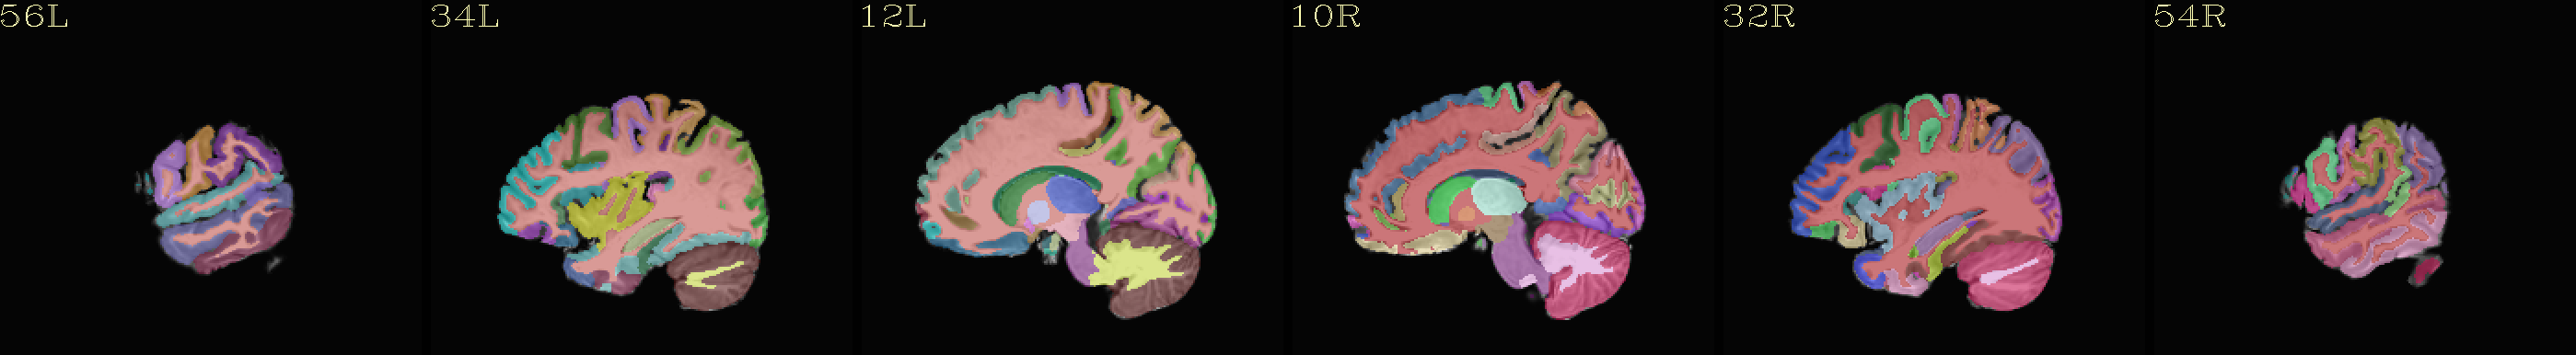
|
|
Supplementary data set: ROI-like GM parcels from individual “2000” atlas overlaid opaquely on “typical” template |
|---|
|
|
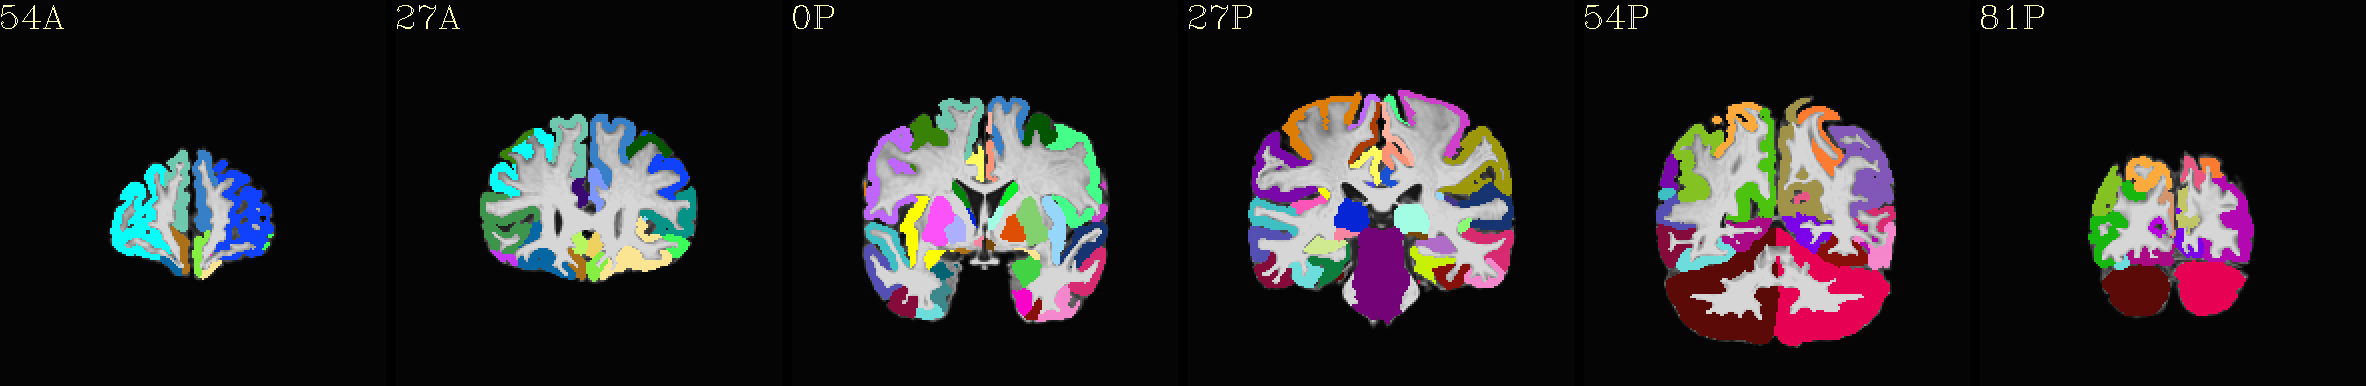
|
Supplementary data set: Tissue map (4 types) from “2000” FS parcellation overlaid opaquely on “group mean” template |
|---|
|
|
|
The script used to make these images with ``@chauffeur_afni`` is
available here: do_01_view_ibt_atlases.tcsh.
Download the IBT datasets
You can download and unpack these in any of the following ways:
(the AFNI way) copy+paste:
@Install_IBT_DATASETS
(the plain Linux-y terminal way) copy+paste:
curl -O https://afni.nimh.nih.gov/pub/dist/tgz/IBT_DATASETS.tgz
tar -xvf IBT_DATASETS.tgz
- (the mouseclick+ way) click on this link,... and then unpack the zipped directory by either clicking on it or using the above
tarcommand.
Citation/questions
If you make use of the IBTs (template) or IBTAs (atlases) in your research, please cite:
Holla B, Taylor PA, Glen DR, Lee JA, Vaidya N, Mehta UM, Venkatasubramanian G, Pal P, Saini J, Rao NP, Ahuja C, Kuriyan R, Krishna M, Basu D, Kalyanram K, Chakrabarti A, Orfanos DP, Barker GJ, Cox RW, Schumann G, Bharath RD, Benegal V (2020). A series of five population-specific Indian brain templates and atlases spanning ages 6 to 60 years. Hum Brain Mapp (accepted).
