7.1. FATCAT Commands
7.1.1. Overview
The Functional And Tractographic Connectivity Toolbox (FATCAT) contains several programs for processing and analyzing MRI data, in particular combining FMRI and diffusion-based data. The programs are designed to work straightforwardly with other analysis tools in the rest of AFNI and SUMA (as well as with other distributions). Moreover, it has already and continues to grow in functionality based on ongoing studies and, importantly, user suggestions. Present capabilities include:
calculating resting state functional connectivity (RSFC) parameters such as ReHo, ALFF, fALFF, RSFA, etc. (3dReHo, 3dRSFC; `-regress_RSFC’ switch in afni_proc.py);
calculating correlation matrices among networks of ROIs and/or whole brain connectivity maps (3dNetCorr);
converting FMRI and other data into networks of target ROIs for tractography (3dROIMaker);
estimating matching volumes between sets of data (3dMatch);
simple DW gradient manipulation (converting columns, rows, and b-matrices; translating between AFNI, TORTOISE and other package conventions; flipping gradient components) as well as simultaneously processing DWI data (combining b=0 volumes; averaging repeated DWIs) (1dDW_Grad_o_Mat, 3dTORTOISEtoHere);
performing deterministic, mini-probabilistic and full probabilistic tractography in a fairly efficient manner and with particular interest in networks of target ROIs, such as functional networks or connectomes (3dTrackID, 3dDWUncert);
user-interactive tracking investigation (via SUMA and AFNI).
generating simulations of Rician-noised data (3dDTtoNoisyDWI);
statistical analysis on a group level: modeling network connectivity (functional or structural) with subject data (e.g., ages, test scores, etc.) using 3dMVM (fat_*.py);
selection of rows and viewing/saving of output matrices (*.grid and *.netcc files) (fat_roi_row.py, fat_mat_sel.py).
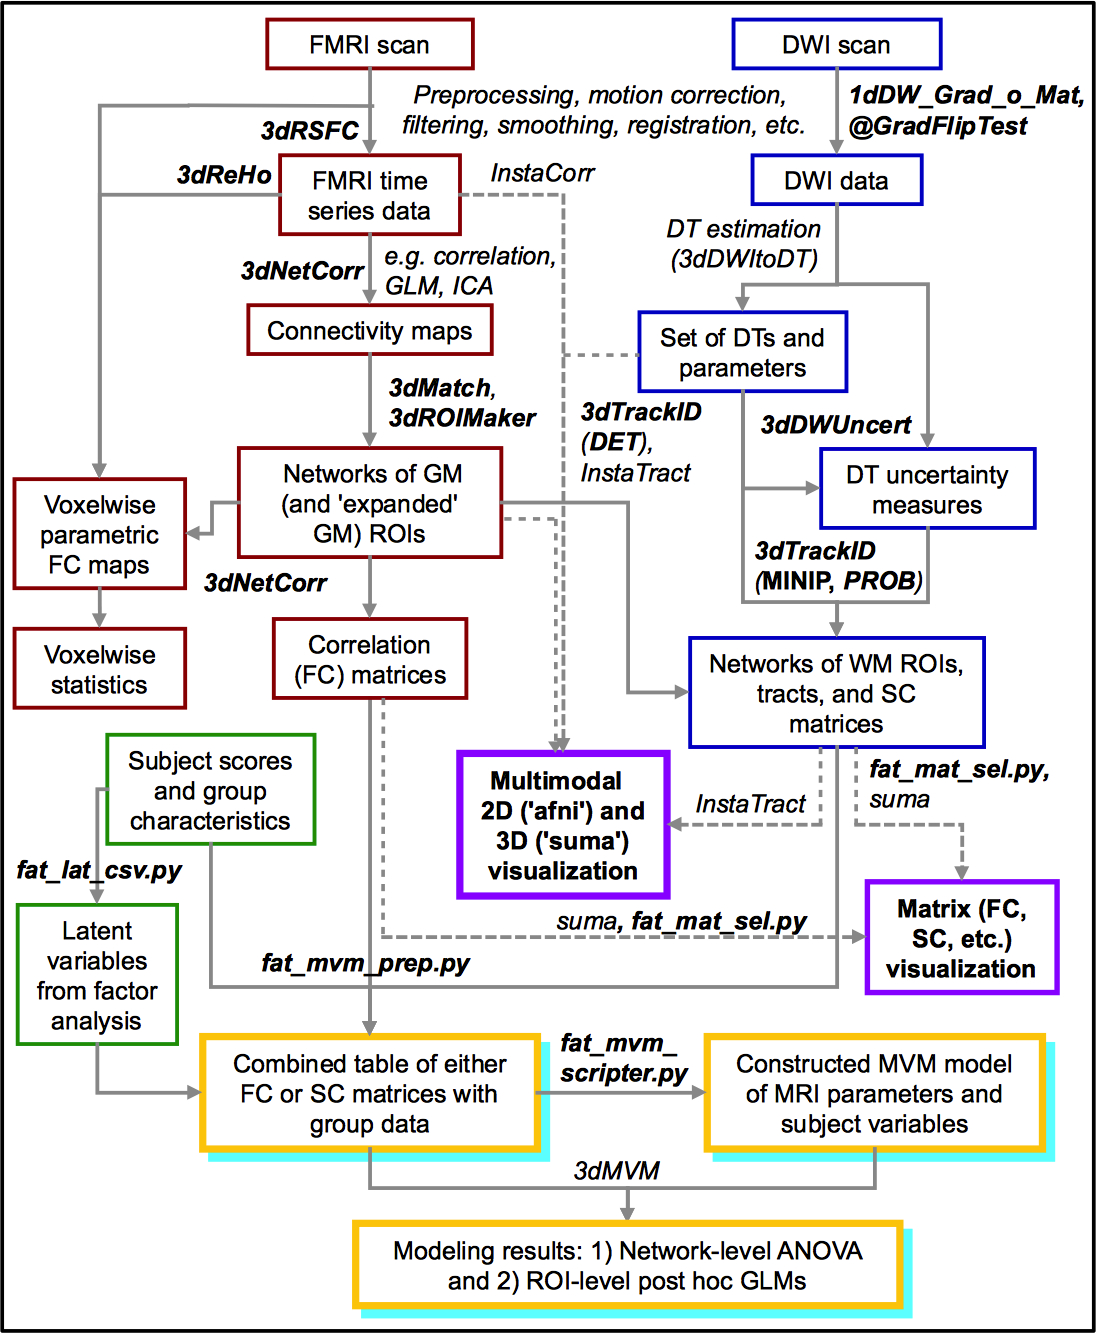
A schematic overview (updated: Oct. 2015) of available FATCAT tools (in bold/italics) and connections with other AFNI and SUMA programs. Red and blue boxes are for FMRI- and diffusion-based data, respectively; purple is for their combination, particularly interactive visualization. Green regions are for processing group characteristic data (such as a spreadsheet/CSV file). Yellow+cyan boxes show steps for combining either FMRI or diffusion data with subject characteristics for group statistical modeling. (link)
Announcements of updates, fixes and new programmation are made and recorded on the AFNI Message Board. This is a useful resource for checking on previously asked (and hopefully answered) questions that come up during analysis. It is also a good first port of call for asking new questions that you yourself might have.
Note
This documentation aims to be a complement to the program helpfiles and demo scripts. It is written in a different style, hopefully taking advantage of the ability to include graphics and images to clarify {e,al,il}lusive points and to make examples. If there are any suggestions to increase clarity, to include further examples or to fix tyypographic errors, please notify the authors.
7.1.2. Demo data sets and scripts
Demo sets are provided for getting acquainted with FATCAT capabilities. Each demo set contains both data and scripts– the latter generally useful descriptions and musings in comments, so they are worth reading when executing the commands. The scripts may provide a useful basis for starting to build pipelines.
Demo sets are most easily obtained via command line. To download and install the primary FATCAT_DEMO, run the following in a terminal:
@Install_FATCAT_DEMO
Further online documentation (with pictures!) is provided at the FATCAT Visualization page.
To download and install the recent demo on combining FATCAT analysis with AFNI’s 3dMVM capabilities (useful for group-level modeling of network properties), run the following in a terminal:
@Install_FATMVM_DEMO
Further online documentation for this is forthcoming…
7.1.3. Other: preprocessing and HARDI considerations
Currently, preprocessing steps (such as corrections for outliers, subject motion, induced eddy currents and magnetic susceptibility) are not treated in FATCAT. For these things, one might use, for example, TORTOISE.
Additionally, tracking capability includes both single
direction-per-voxel (i.e., DTI-based) and multiple direction-per-voxel
(i.e., HARDI-based) methodology. While AFNI contains 3dDWItoDT to
estimate diffusion tensors and parameters, it currently does not
possess a HARDI modeller itself. There are several other programs
available for estimating the main directions of tract propagation,
though the degree of integrability with FATCAT may vary. One example
of using DSI-Studio to perform
HARDI modeling and converting the output to be 3dTrackID-able is
provided in the FATCAT demo: FATCAT_DEMO/HARDI/do_dsistudio.tcsh.
7.1.4. Notation Notes
The aim of this documentation is to inform what tools are available for data analysis, and to facilitate their use. The hope is that the notations involved in describing the code and making general examples are clear. Current format choices include:
command line names are written in a font like this:
Font;references to switches in a command line program are written like
-switch, and these take no arguments after the option name;options that require arguments such as file names or numbers are written as
-option_name *, where the wildcard character ‘*’ itself would not generally be typed– it is used non-literally to reinforce that something else needs to be typed after the option name;some options take only specific keywords as arguments. The set of keys will be presented in curly-brackets “{…}” with elements separated by a vertical line “|”. When described, those will often be presented in the following format,
-option_name
{KEY1|KEY2|KEY3|...}
, by which the user is expected to select only one key when actually calling the option in the command line (e.g.,-option_name KEY2);in command line examples, non-literal filenames are typed in all-capital letters with descriptive words separated by the underscore character ‘_’, such as
ROI_FILE;in command line examples, non-literal numerical arguments would be held by a single capital letter, such as
XorY.
7.1.5. Citation Notes
Useful papers describing FATCAT (+ AFNI + SUMA) tools are:
- Taylor PA, Saad ZS (2013). FATCAT: (An Efficient) Functional And Tractographic Connectivity Analysis Toolbox. Brain Connect. 3, 523–535. doi.org/10.1089/brain.2013.0154
Introducing diffusion-based tractography tools in AFNI, with particular emphases on complementing FMRI analysis and in performing interactive visualization with SUMA. NB: some names of functions described in this initial paper have changed, for example:
3dProbTrackID->3dTrackID -mode PROB. - Taylor PA, Chen G, Cox RW, Saad ZS (2016). Open Environment for Multimodal Interactive Connectivity Visualization and Analysis. Brain Connect. 6, 109–121. doi.org/10.1089/brain.2015.0363
Further network-based tools for both FMRI and diffusion-based analyses, as well as their combination. New tools include: a new tracking methodology (the “mini-probabilistic” approach); more interactive visualization with SUMA+AFNI; and a description of the multivariate framework for statistically modeling network-based features in group analysis (using the existing 3dMVM tool).
- Taylor PA, Jacobson SW, van der Kouwe A, Molteno CD, Chen G, Wintermark P, Alhamud A, Jacobson JL, Meintjes EM (2015). A DTI-based tractography study of effects on brain structure associated with prenatal alcohol exposure in newborns. Hum Brain Mapp. 36(1):170-186. doi:10.1002/hbm.22620 | https://pubmed.ncbi.nlm.nih.gov/25182535/
An applied paper showing examples of FATCAT tracking (including one application of “mini-probabilistic” tracking) and group analysis with multivariate statistics.
