This visualiztion ties in with the current FATCAT Demo, which has a
number of data sets and commented scripts. If you don’t have it
already (?!?!), then please check out the Demo installation
instructions?.
At some point you should read the README file under FATCAT_Demo, and
go over the comments in each of the scripts that provide context to
the different commands used. Scripts Do_*_VIS* are meant to illustrate
interactive visualization of the results. The scripts will open
results in AFNI and SUMA and a prompt window will guide throuh basic
viewing steps. See also the quick tour for tract
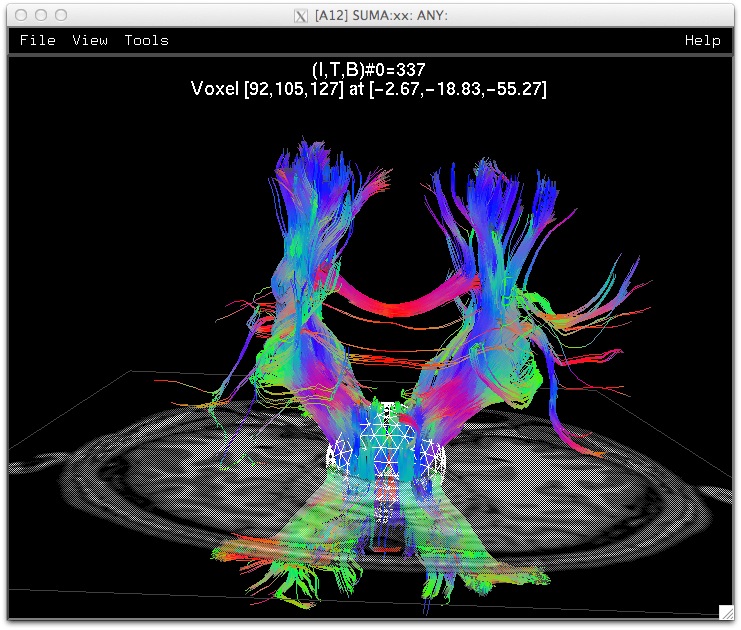
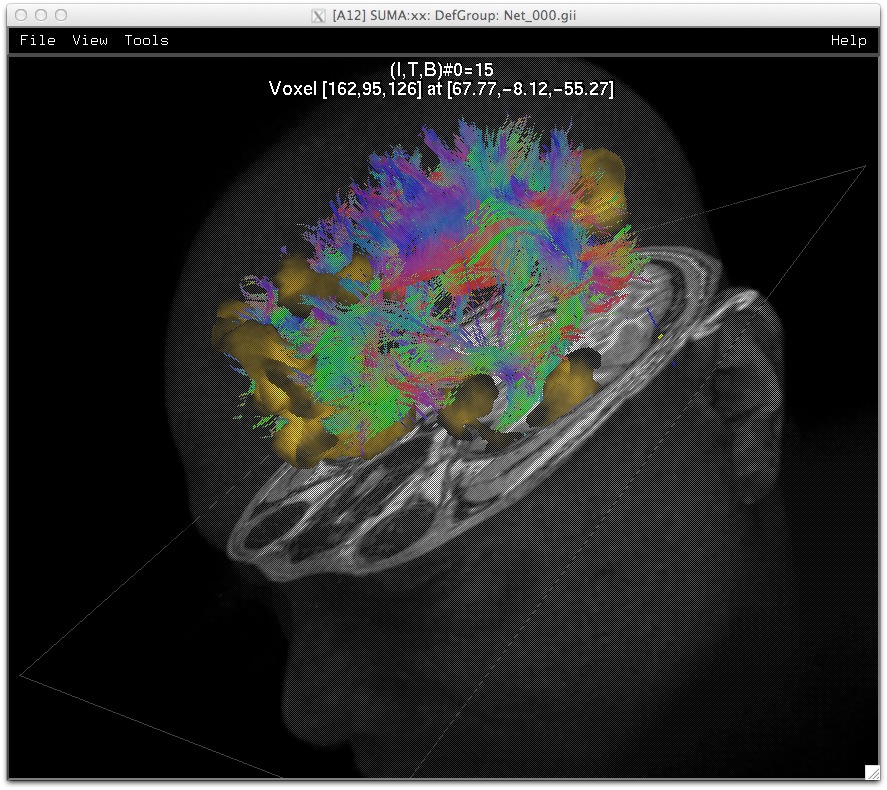
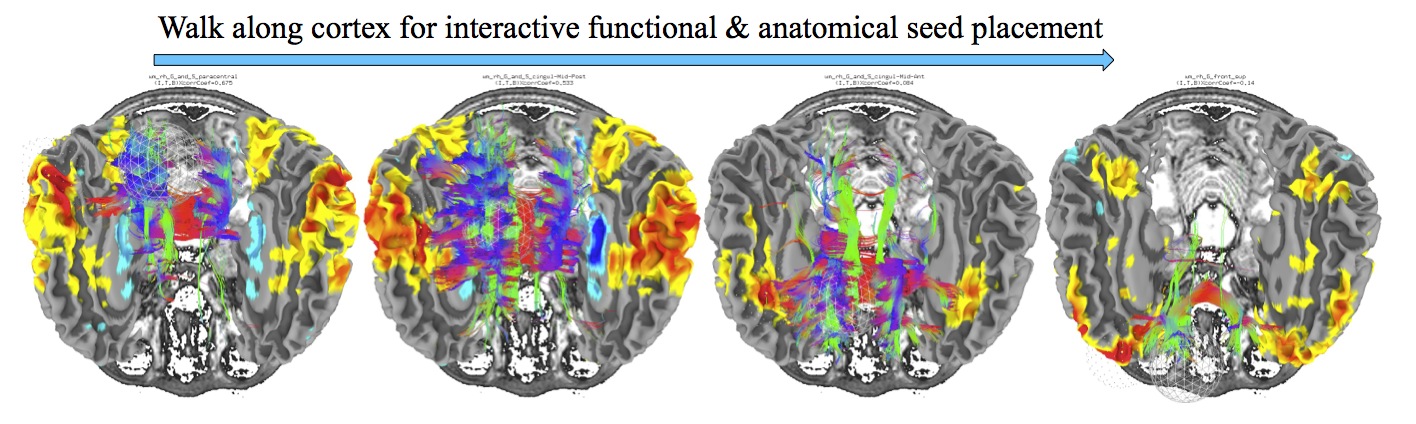
viewing. You should be able to create images such as
the ones shown above. Fun times!
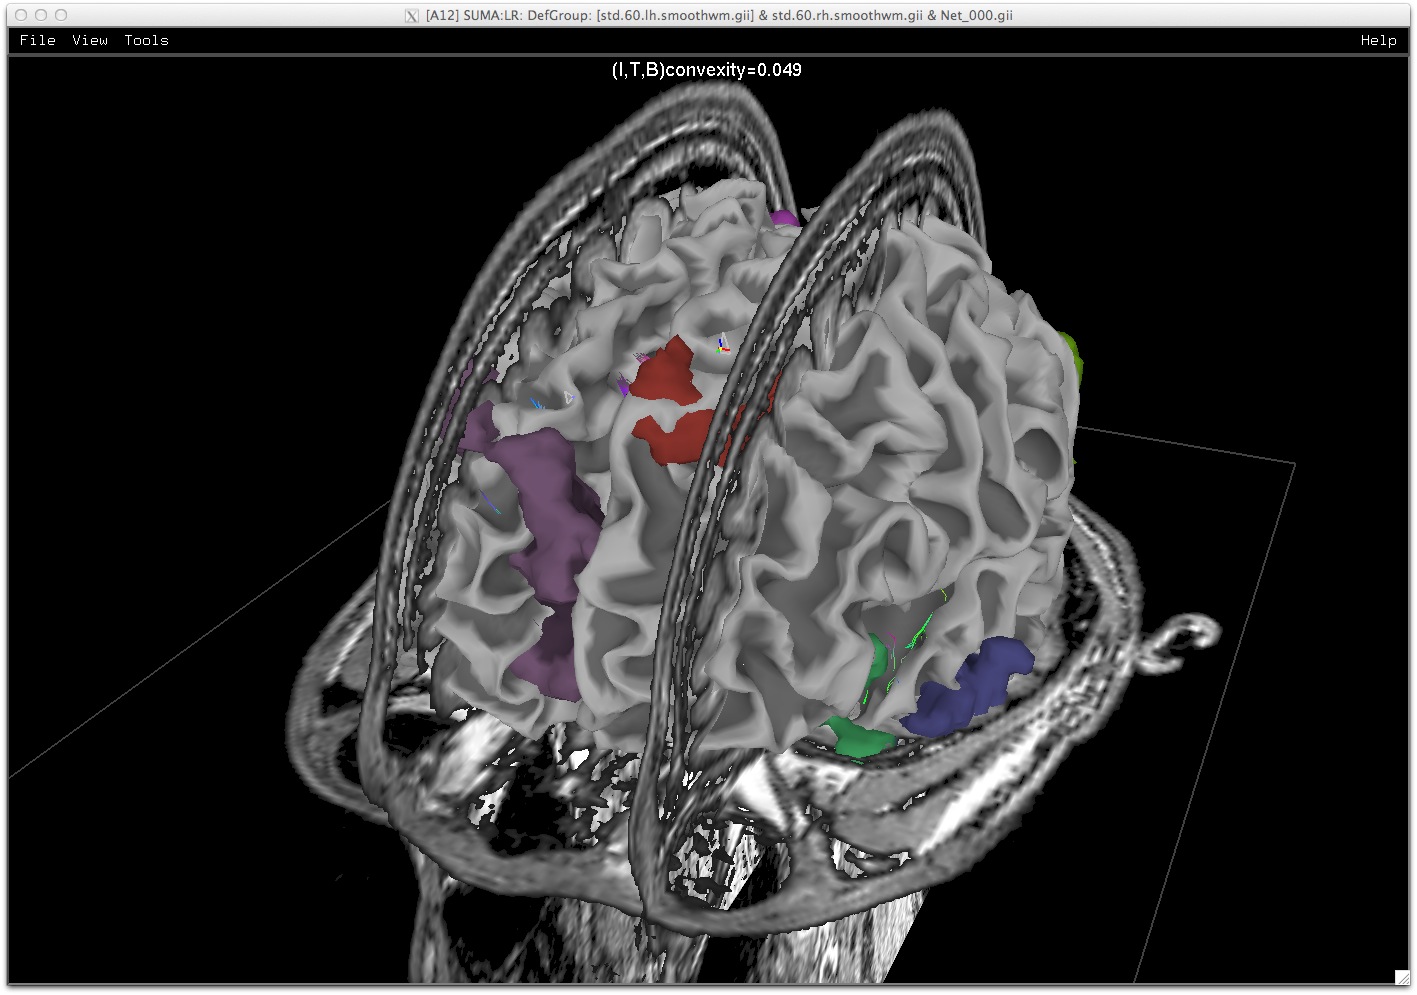
Results visualized by script Do_09_VISdti_SUMA_visual_ex2.tcsh
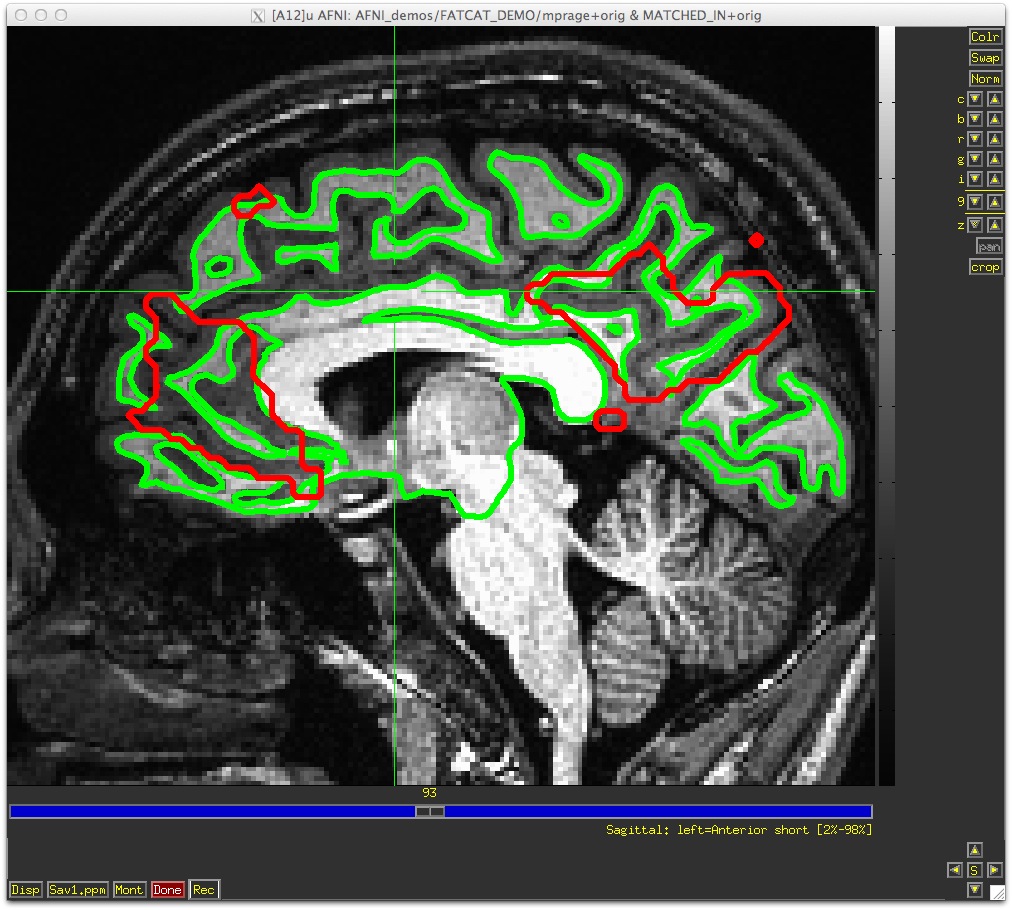
Surfaces with surface contour (see IsoSurface) of ROI in color, slices, and tracts barely visible. ref:(link)<media/Do_06_vis2.1.jpg>
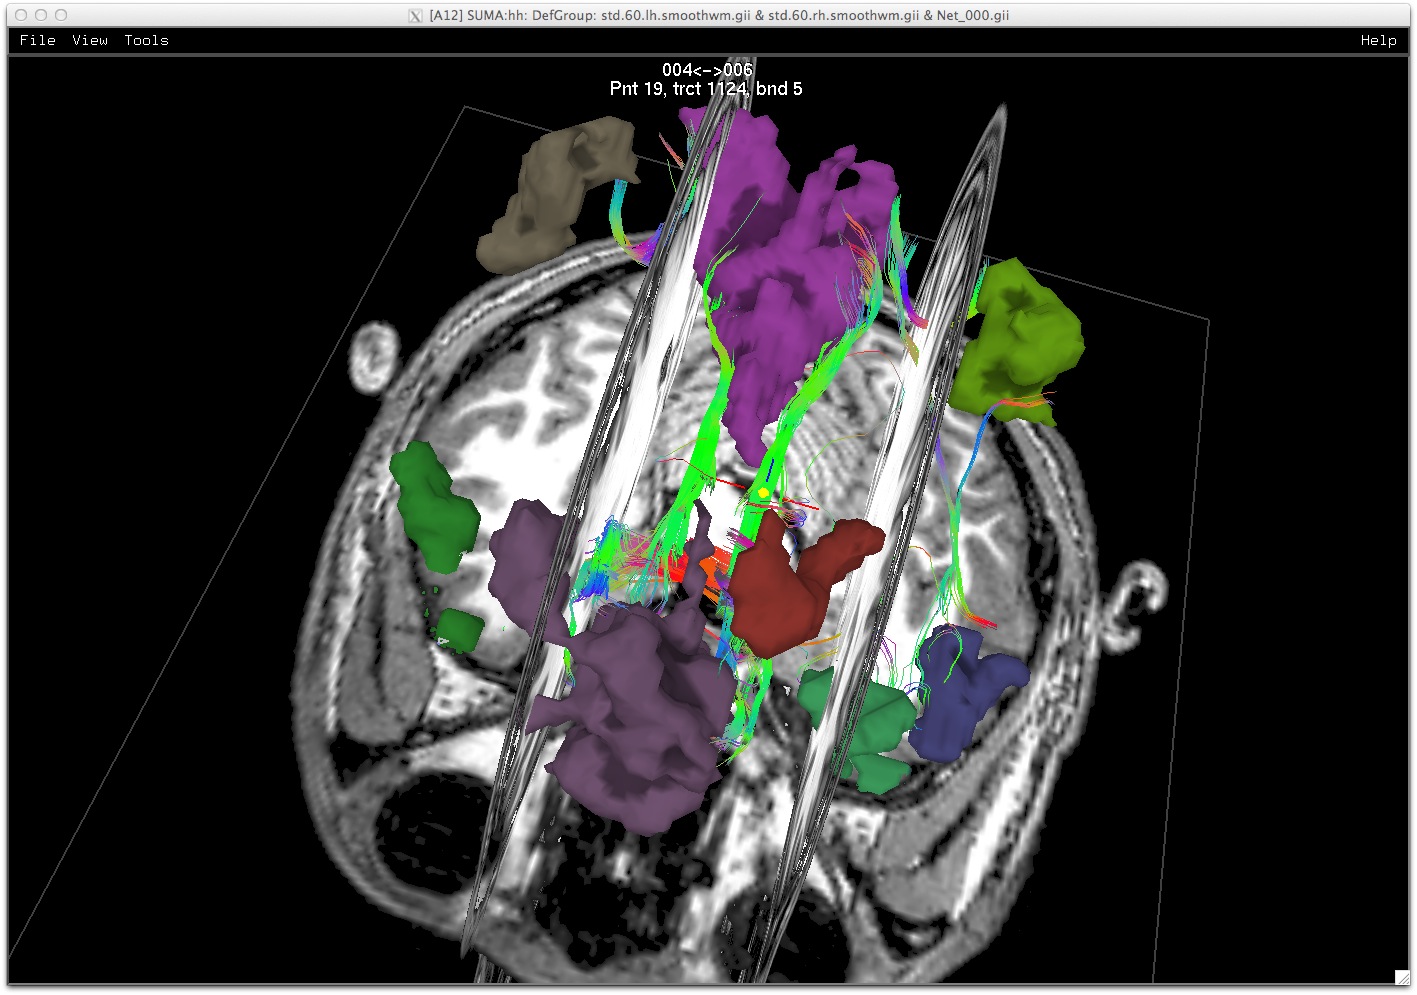
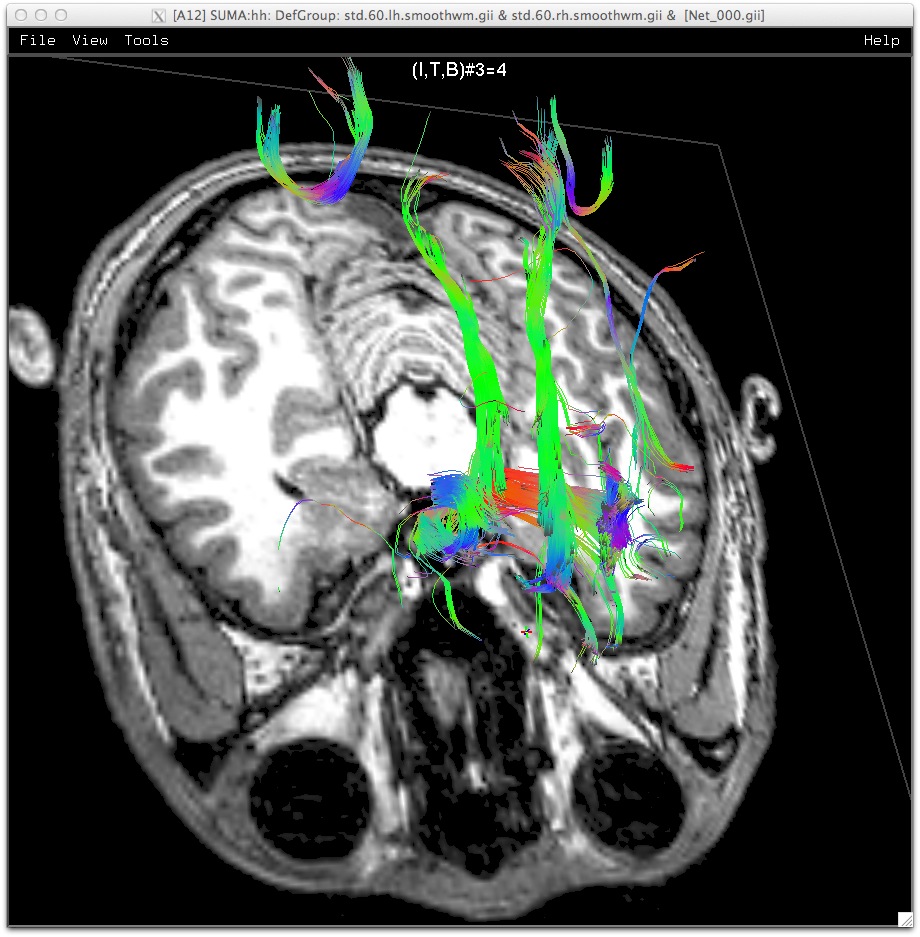
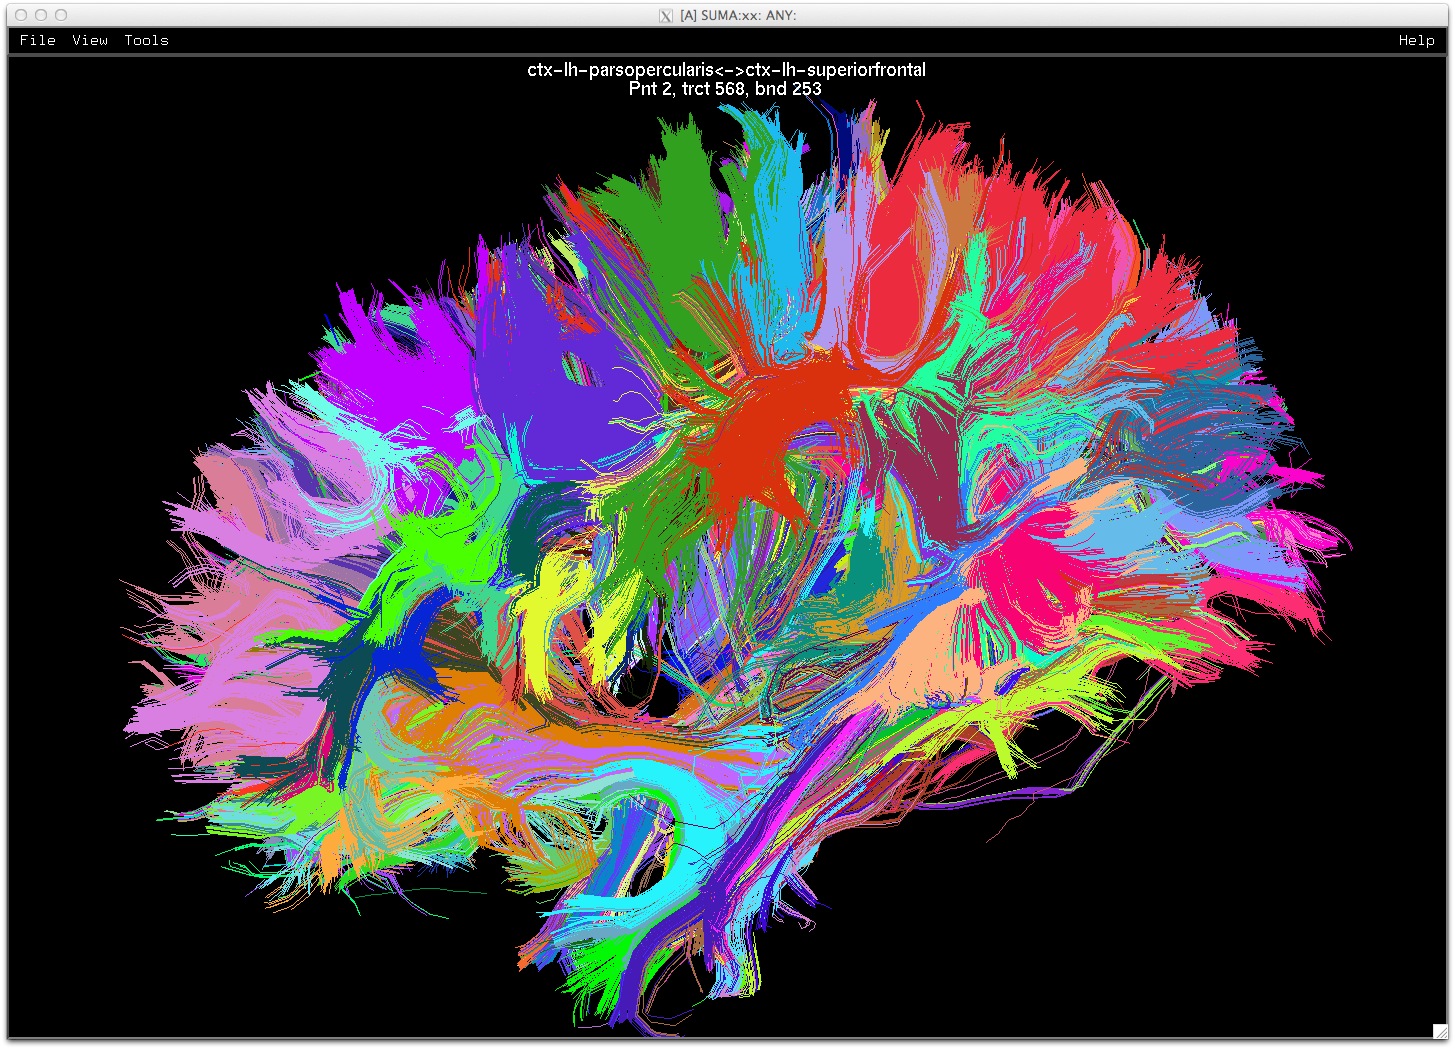
Surfaces hidden to reveal deterministic tracts through ROIs of the DMN. ref:(link)<media/Do_09_vis2.2.jpg>
Connection is maintained with AFNI which is displaying intersection of surfaces with the volume. Clicking anywhere in SUMA will cause AFNI to jump to the corresponding location. (link)
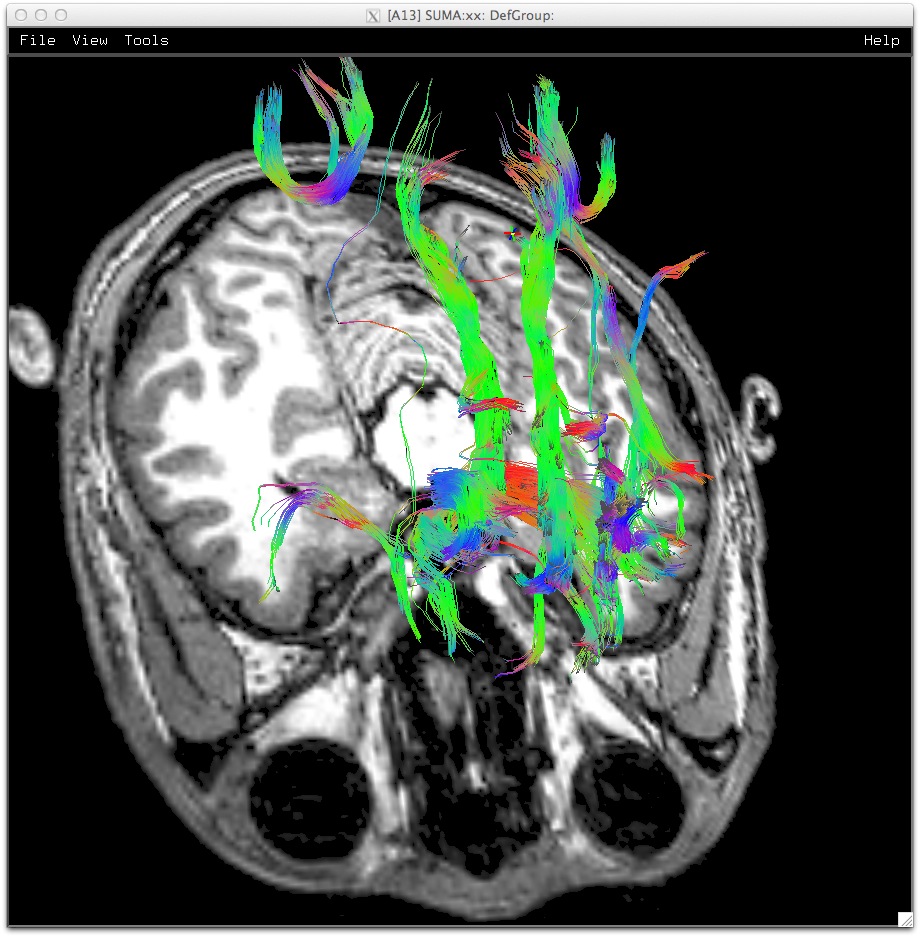
Comparison of deterministic to mini-probabilistic results.
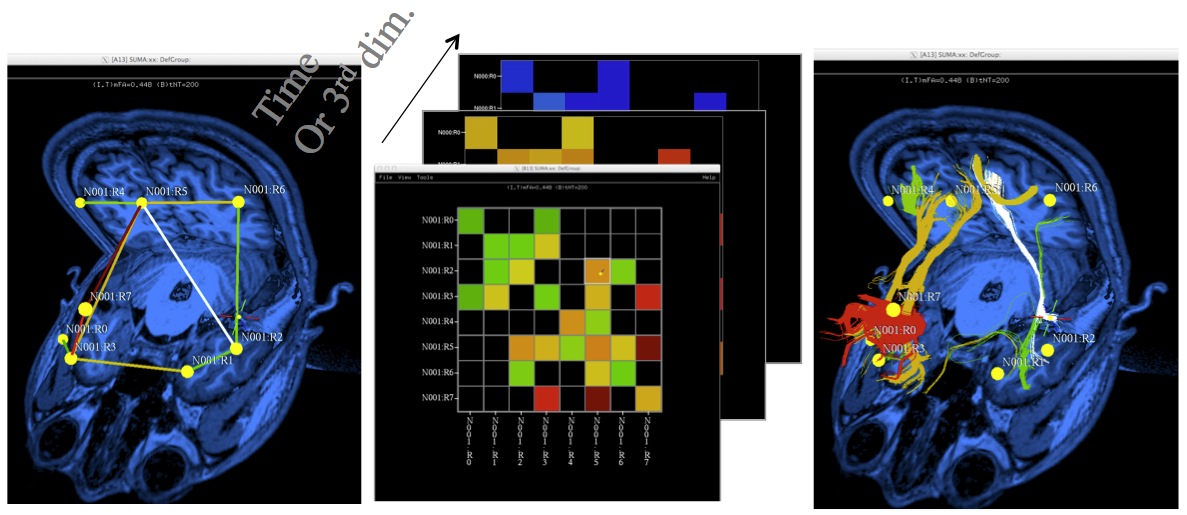
Script Do_09_VISdti_SUMA_visual_ex3.tcsh can be used to demonstrate simultaneous, interactive, functional and anatomical connectivity. Just follow the directions that come up on the screen when you launch the script.