5.1.4. AFNI GUI: Graph window

Open Some Graph Windows

  • Graph buttons for the adjacent views (Axial, Sagittal, Coronal)

    • Normal: button opens a viewing window

    • Inverted: button raises opened window

    • Right-click on an inverted button ‘fetches’ the graph window

  • Graph buttons are usually only meaningfull if the selected underlay dataset has a time index (usually some functional image)

  • Graph buttons are only enabled for datasets that are viewing their data files directly

    • Not warping on demand – see the top of the Define Datamode control panel (see here)

../../_images/graph_window_open.png

Graph Window

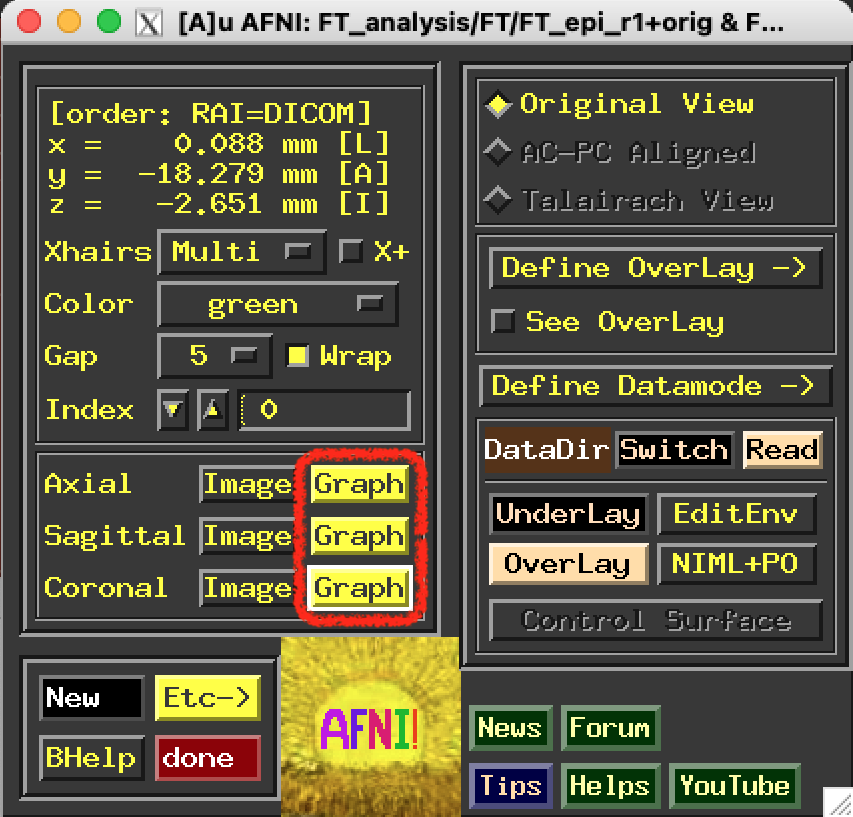
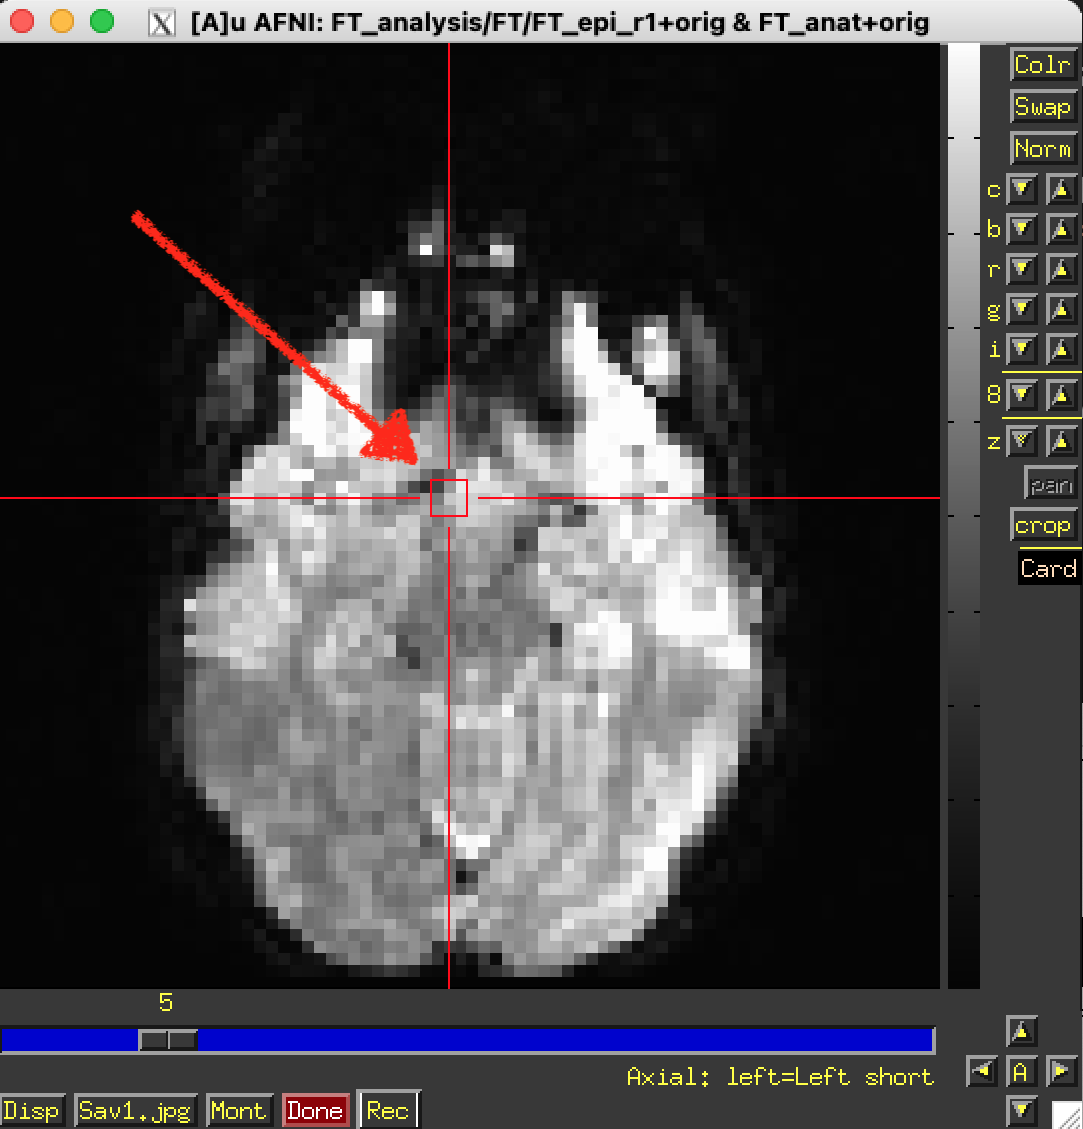
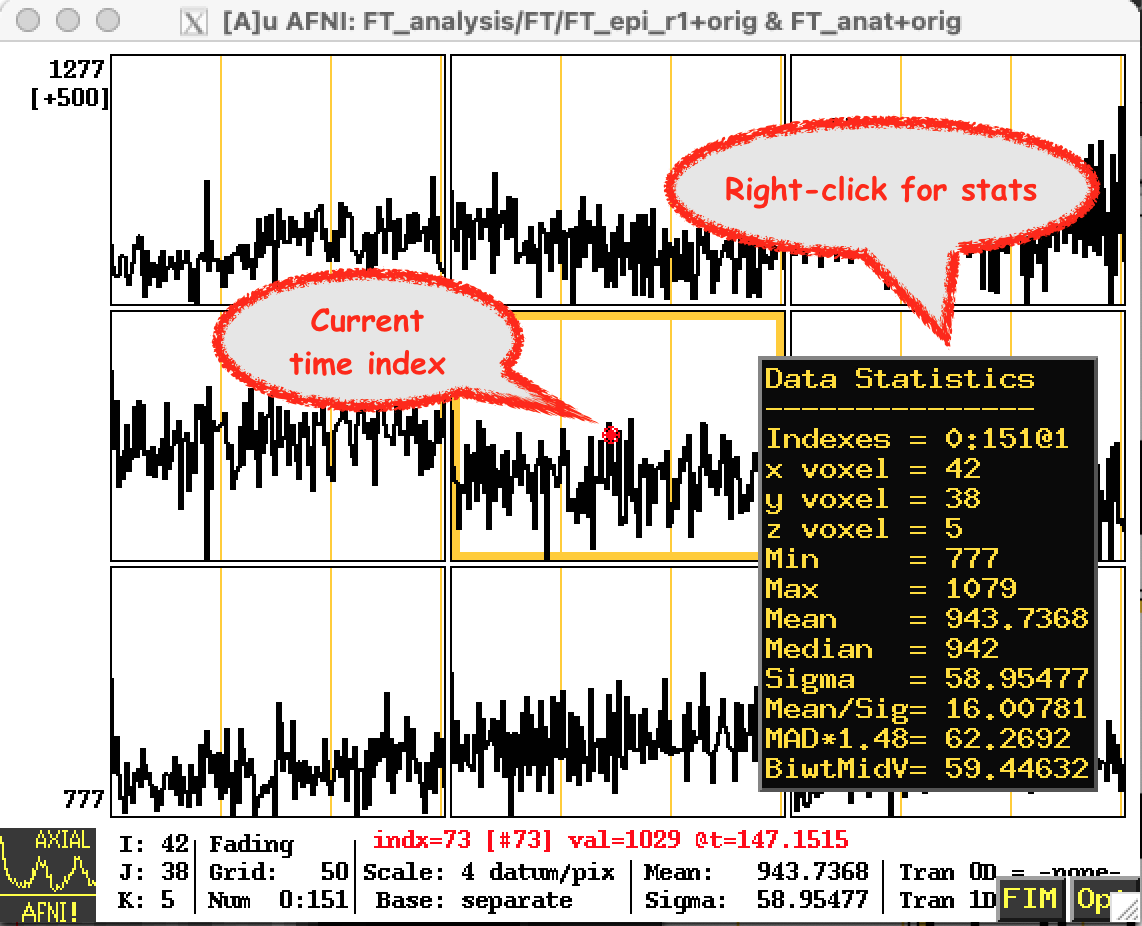
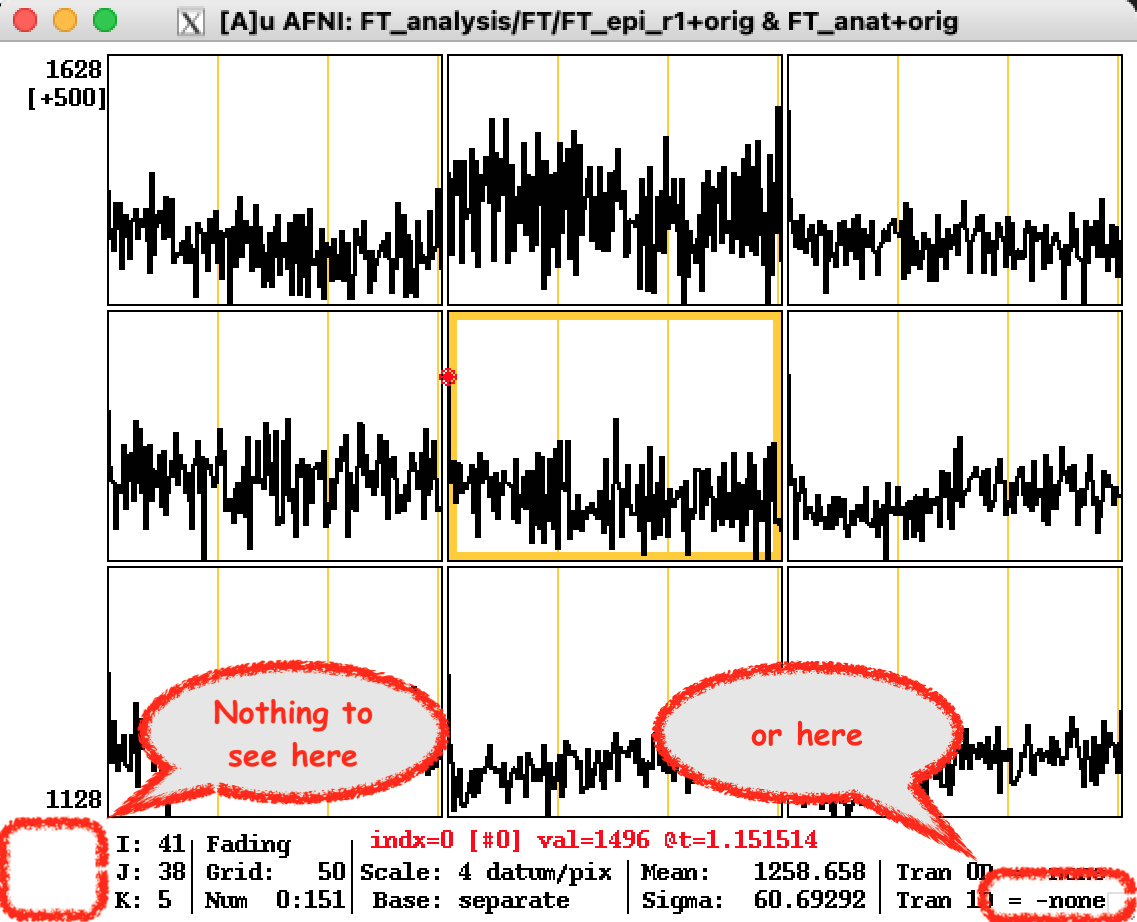
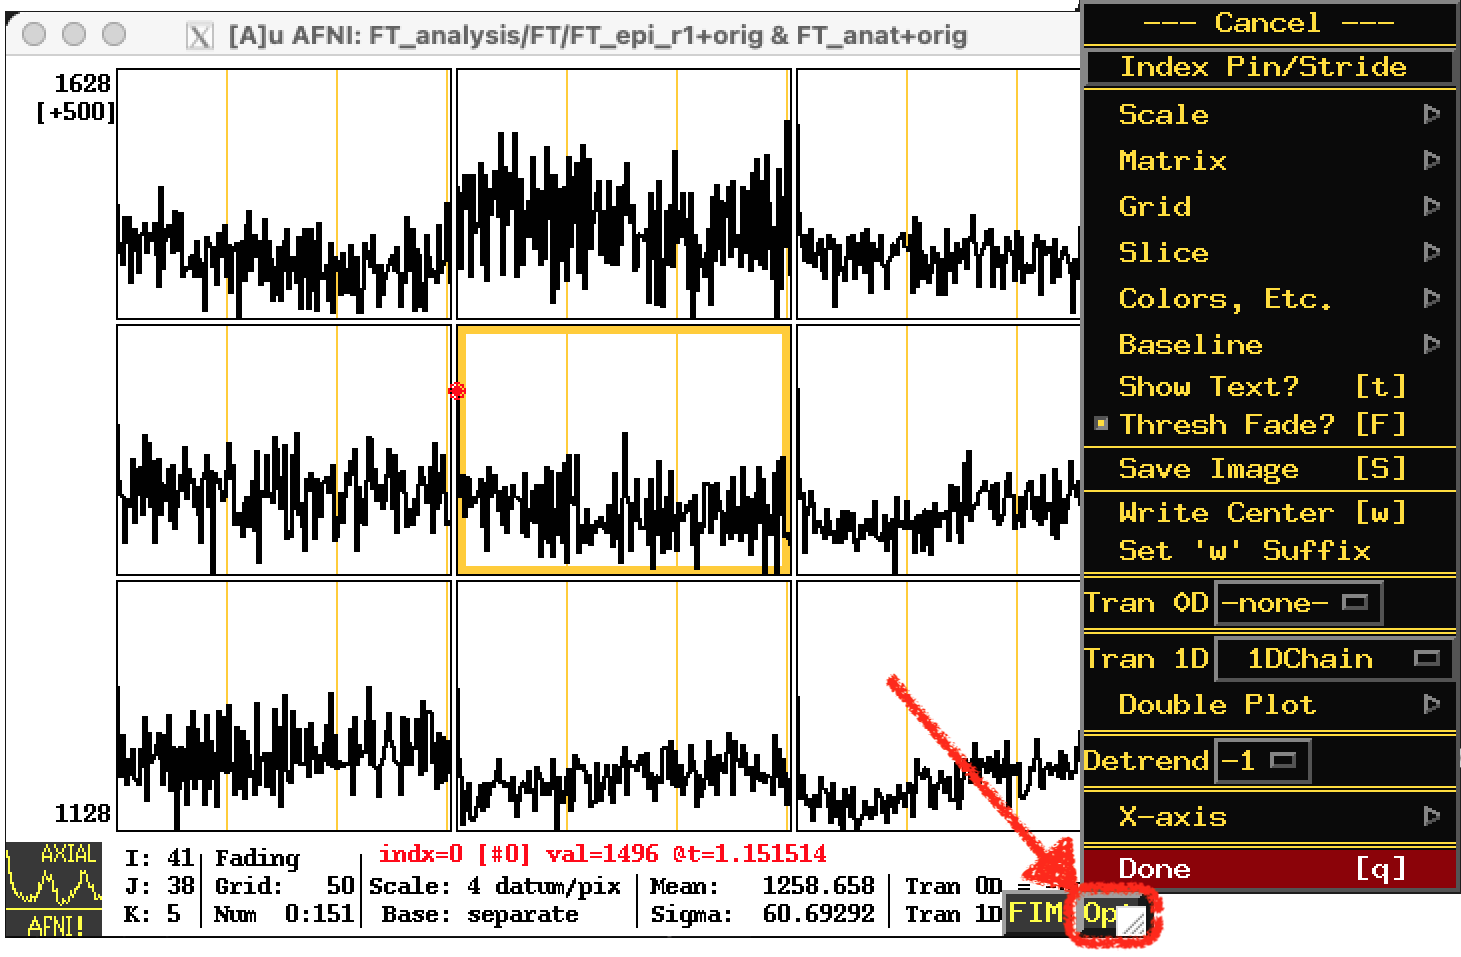
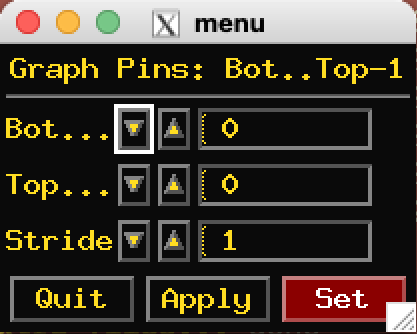
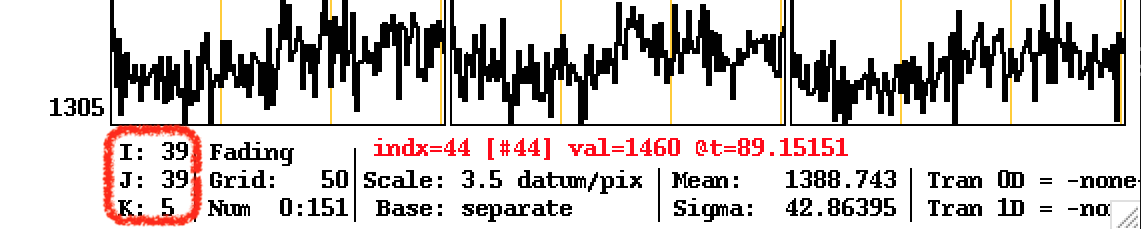
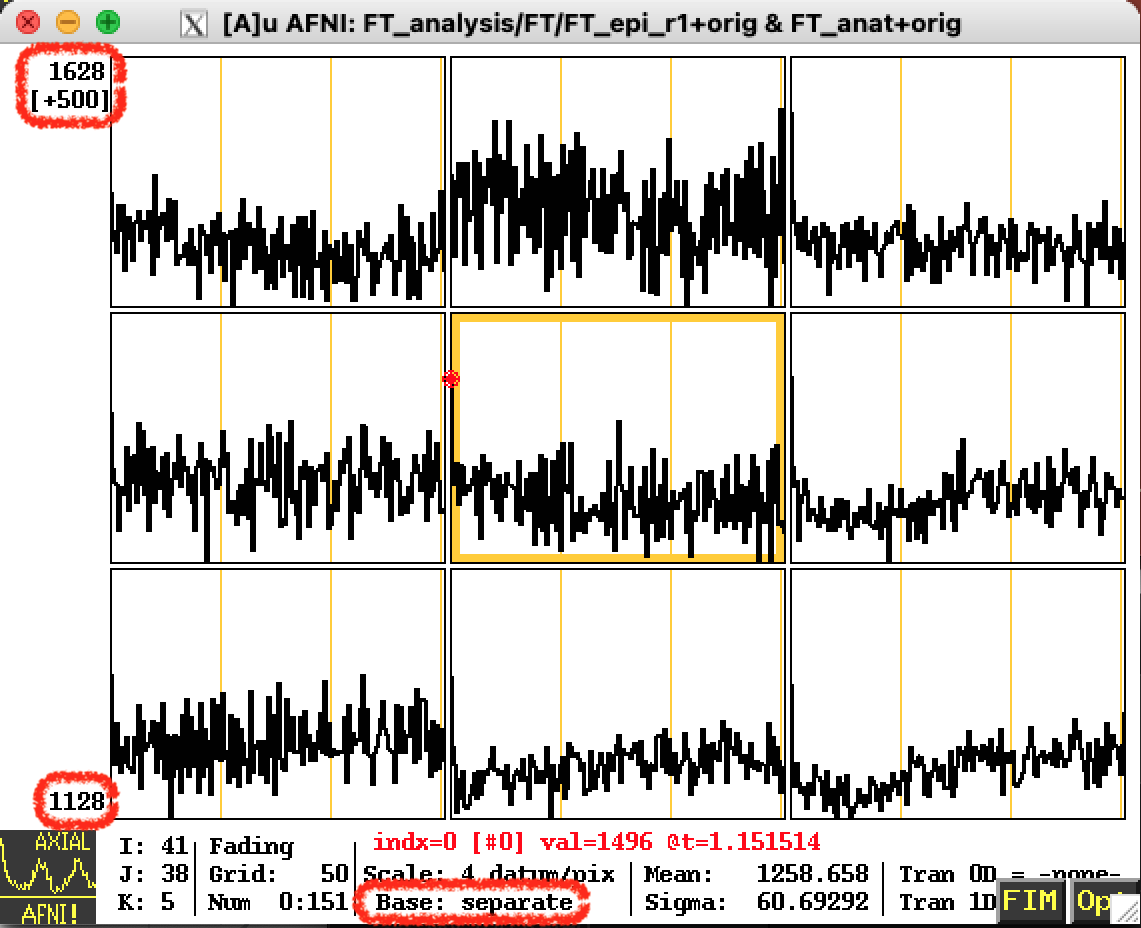
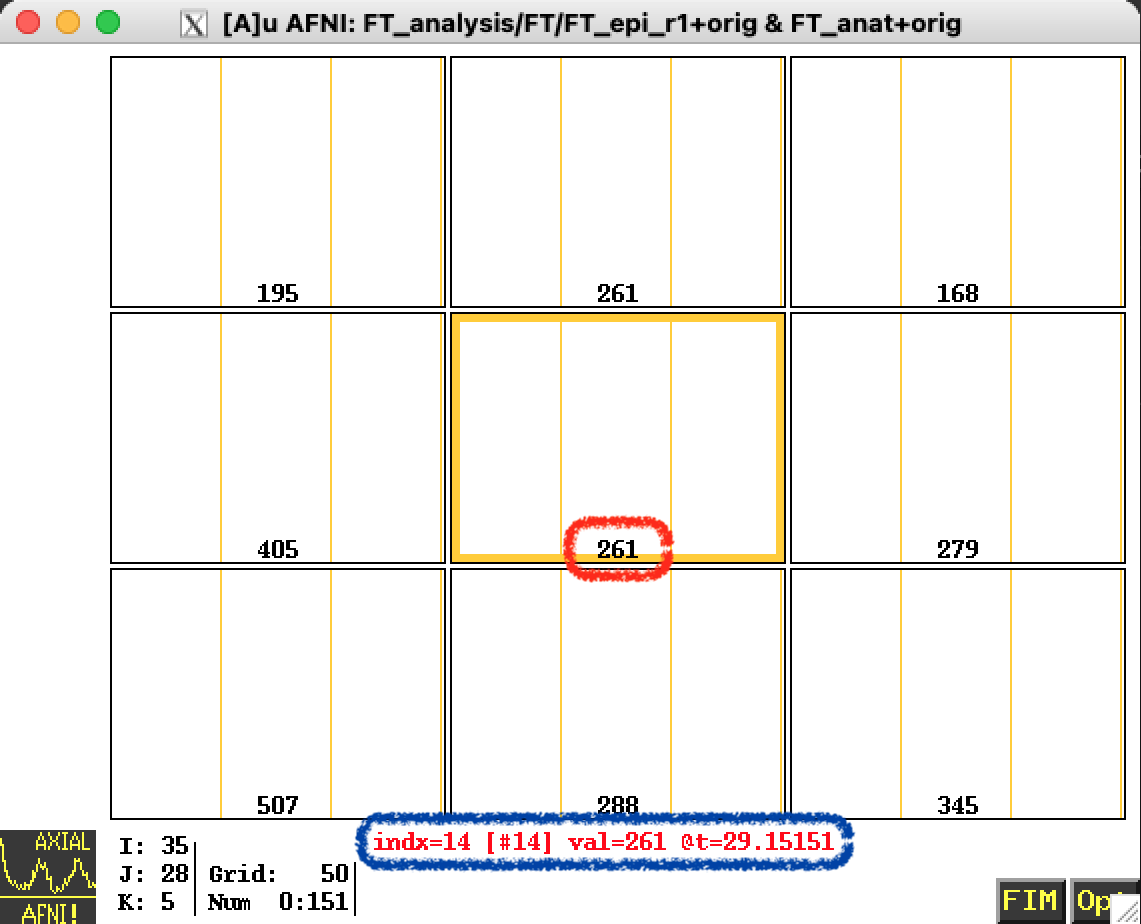
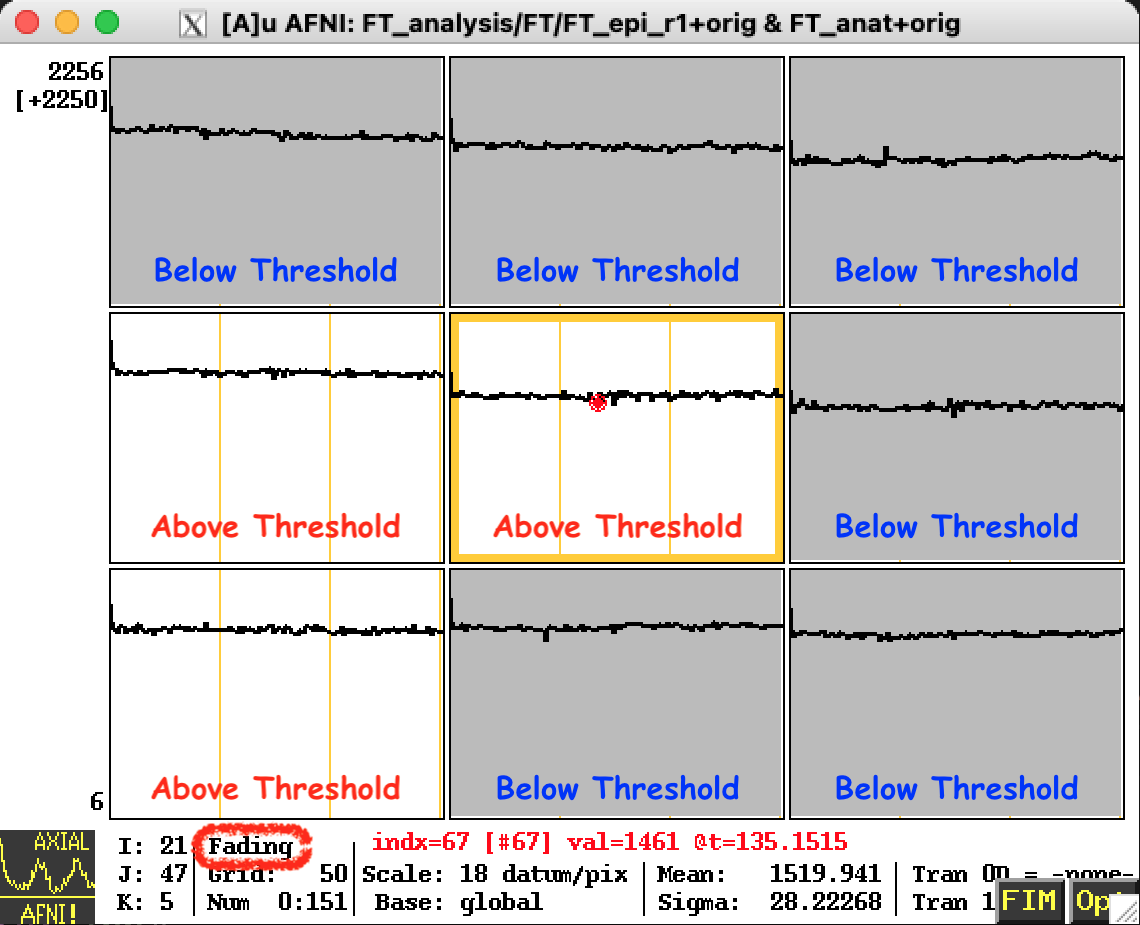
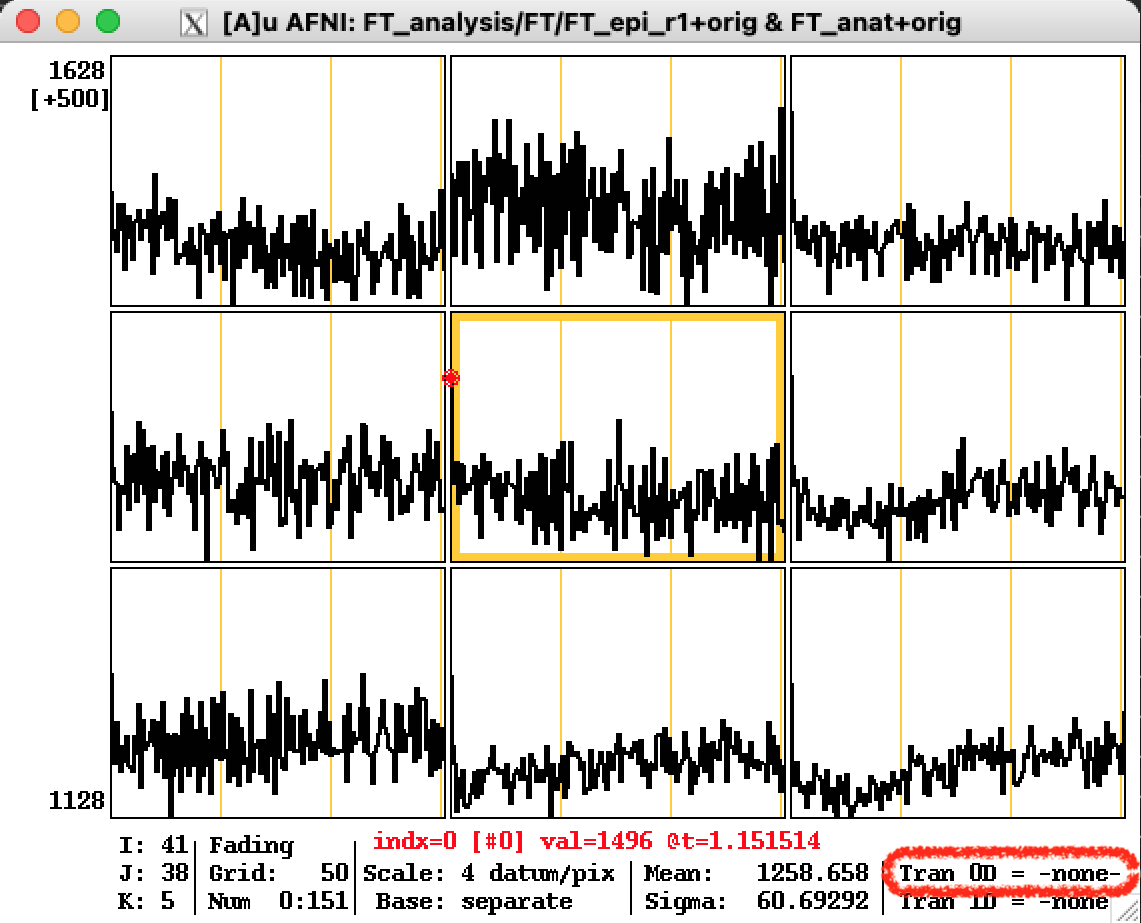
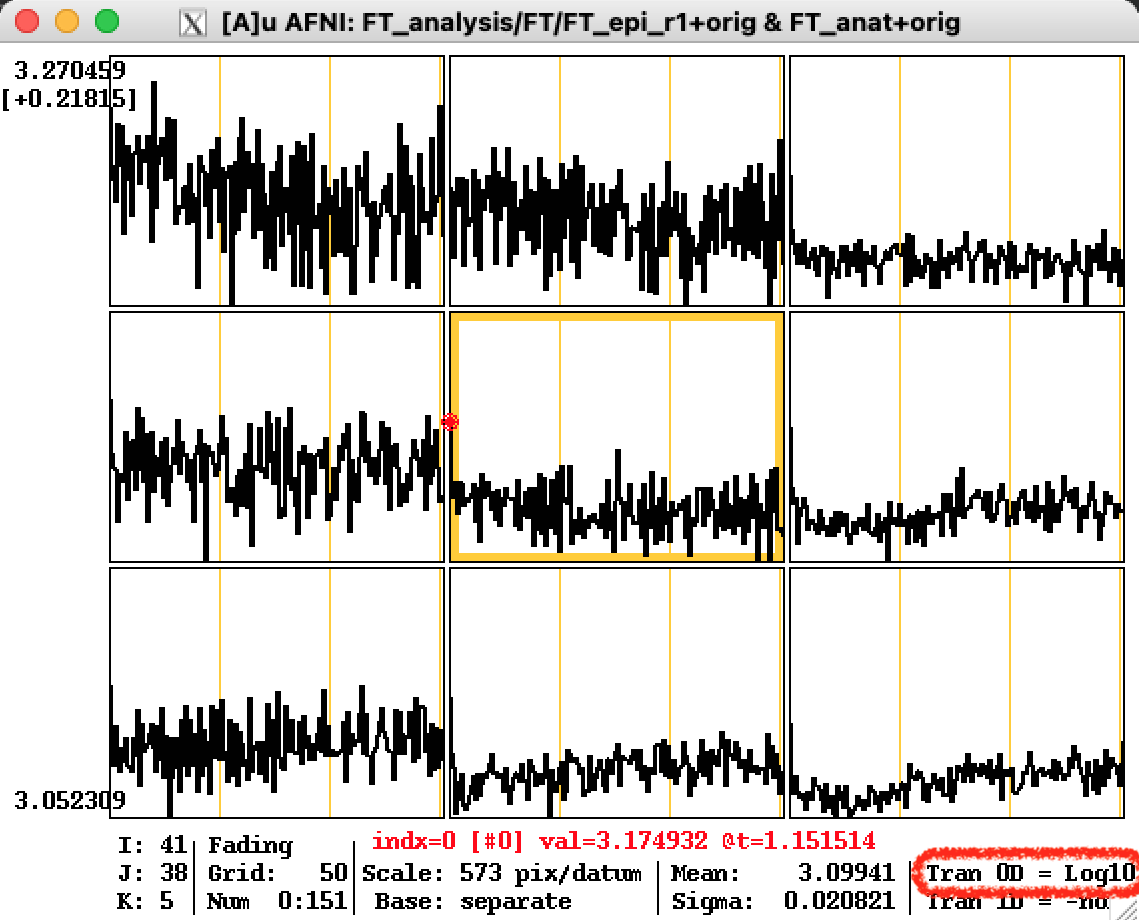
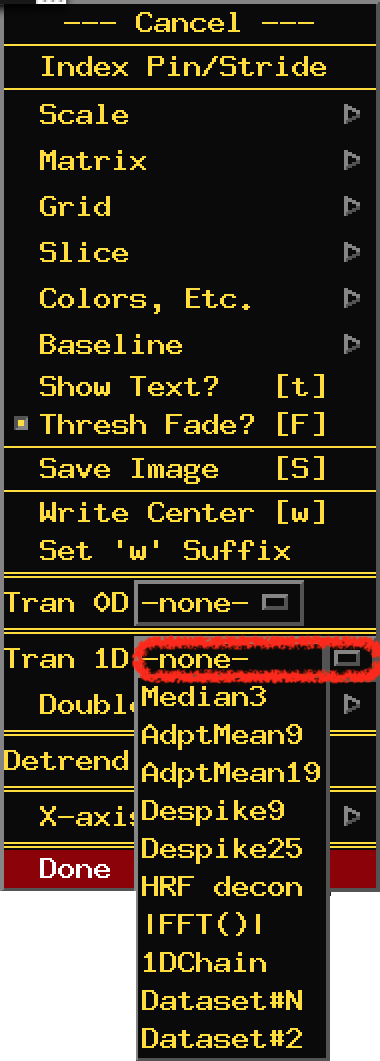
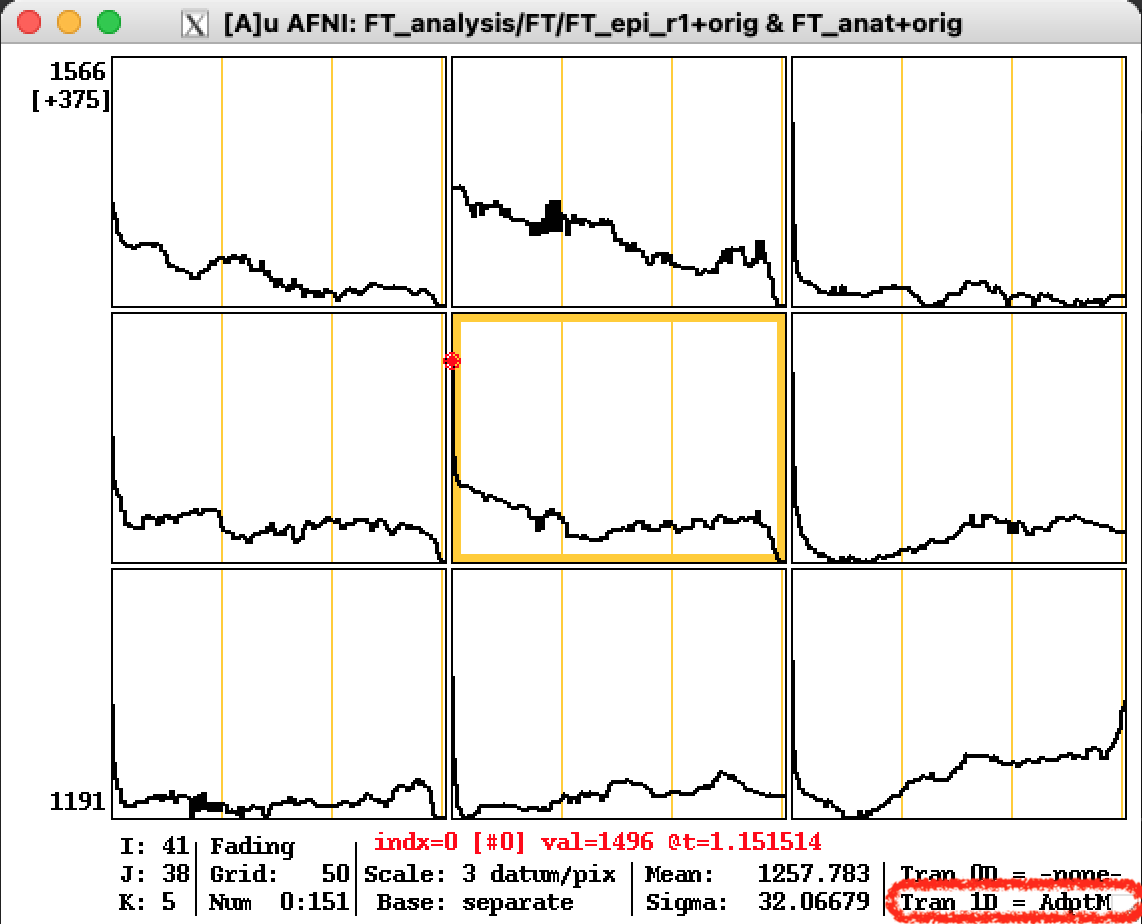
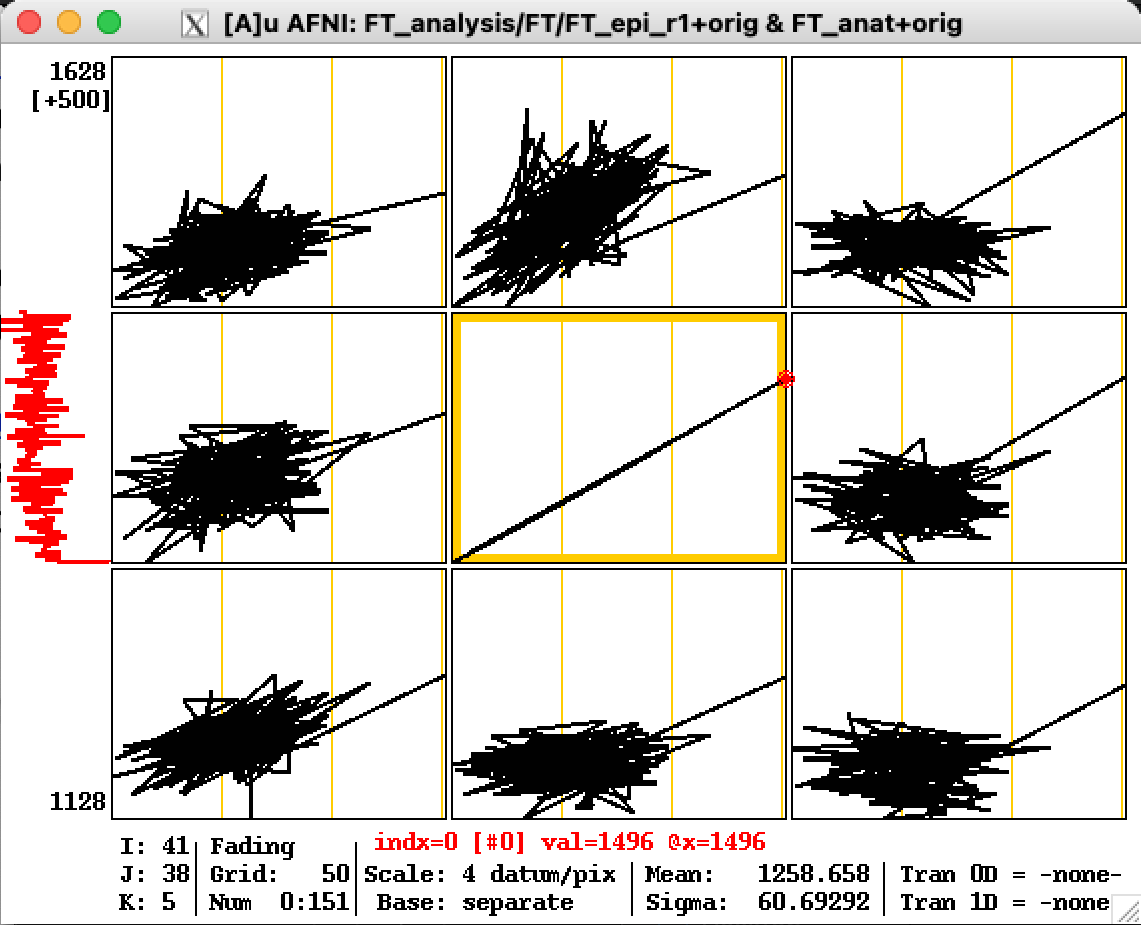
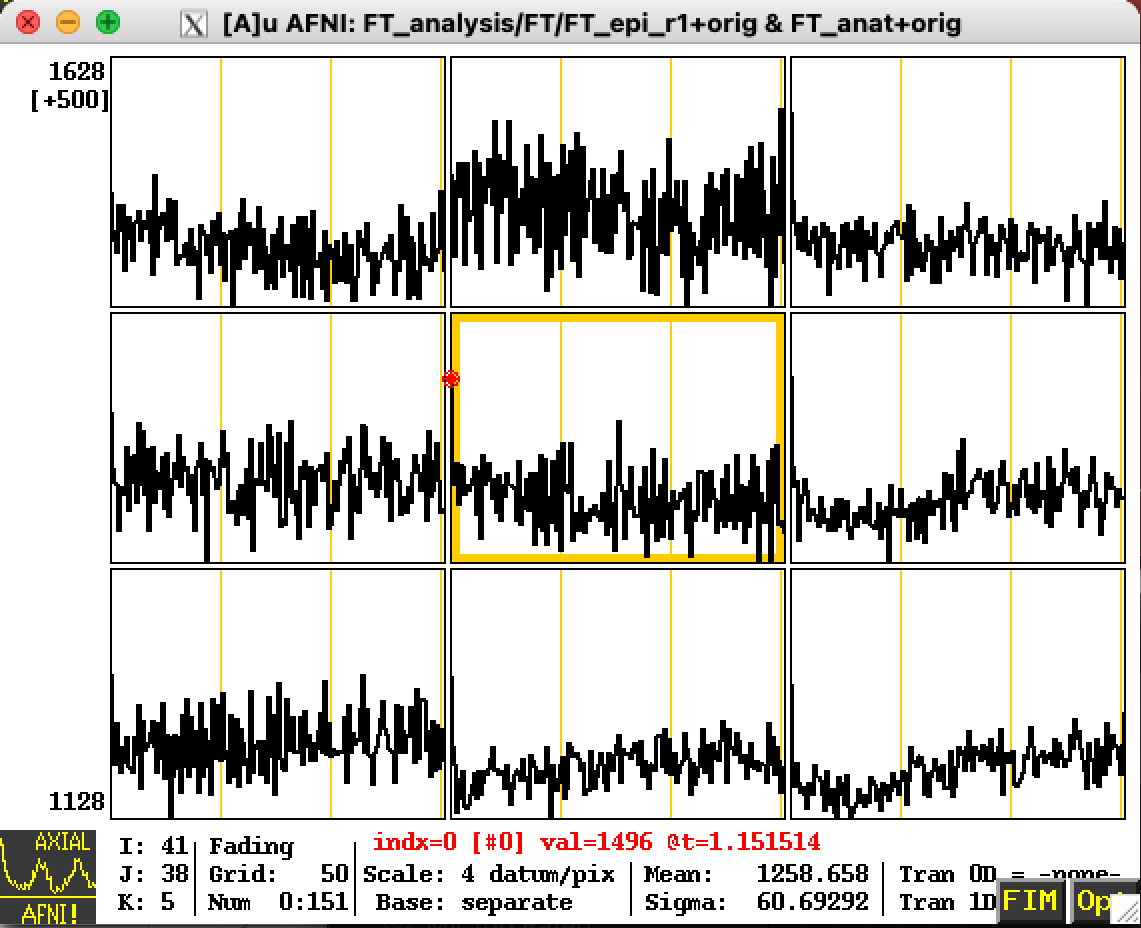
  • Graph viewer takes voxel values from same dataset as image viewer

    • If dataset has only 1 sub-brick, graph viewer only shows numbers (Not very useful unless you are an MRI physics type, perhaps)

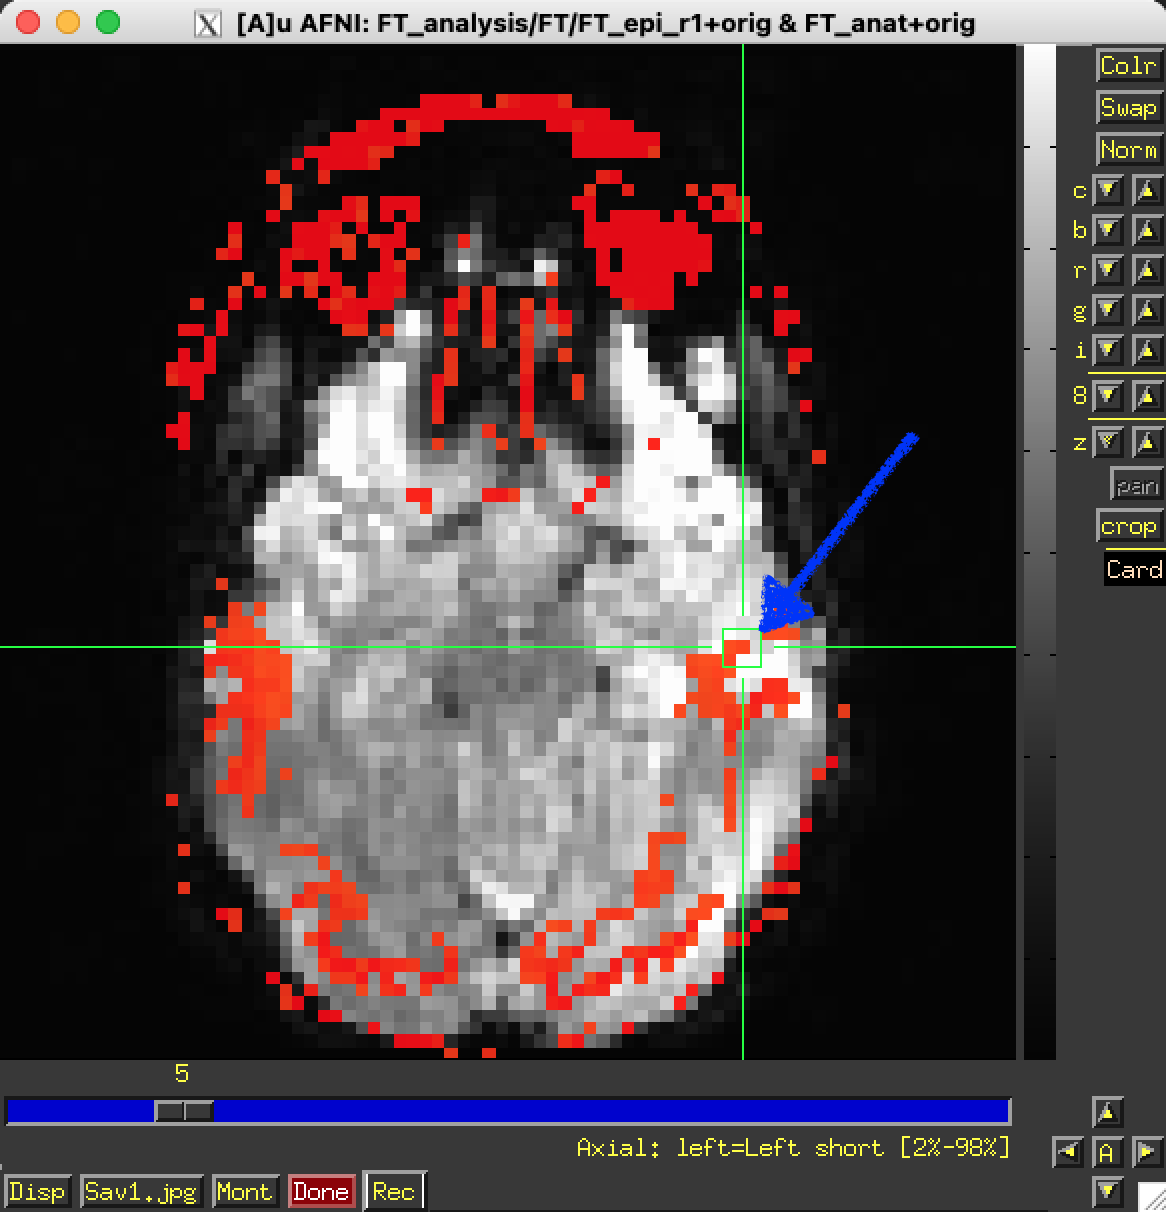
  • To look at images from one dataset locked to graphs from another dataset, must use 2 AFNI controllers and Define DatamodeLock on AFNI control panel

  • Keystrokes in graphs that have no menu items are:

    • < or , or left-arrow keys move the time index down by one.

    • > or . or right-arrow keys move the time index up by one.

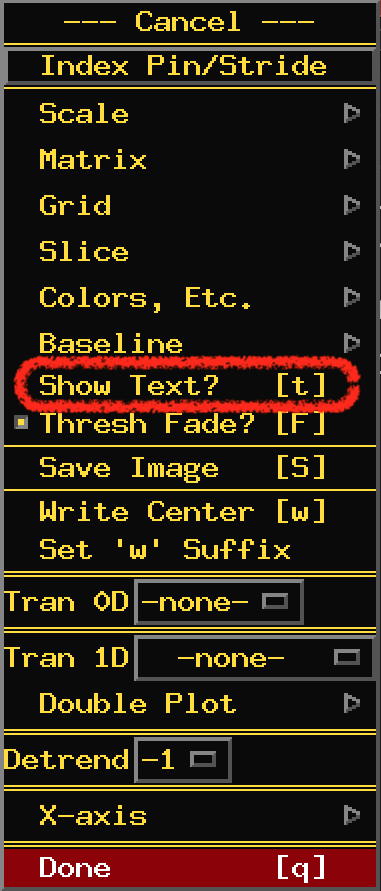
    • L turns off/on the AFNI logo in the lower left corner.

  • The following are video mode operations moving the cursor through the time index. An easy way to animate an EPI time series, to look for subject motion.

    • v moves through the data forwards and jumps back to the start of the graphs when it gets to the last time index.

    • V is the same only it moves the cursor backwards.

    • r moves forwards but bounces back from the last time index.

    • R moves backwards and bounces back from the first time index.

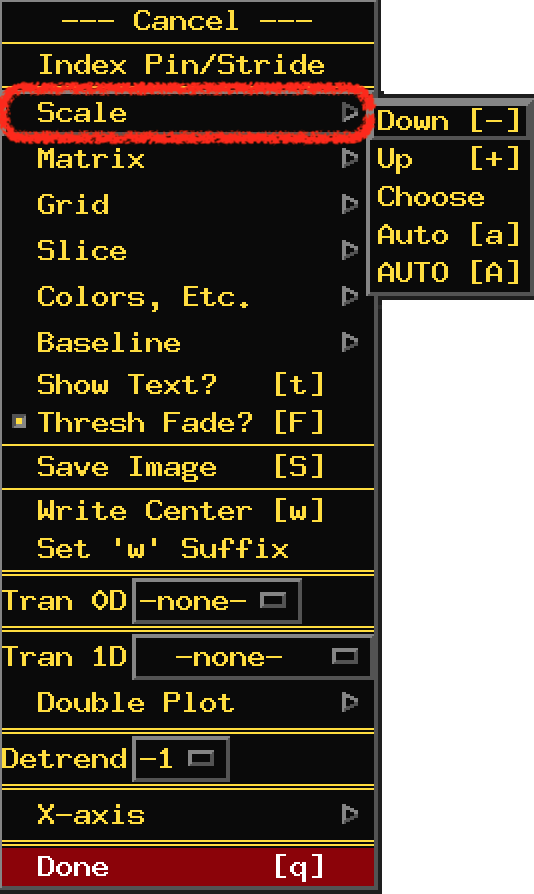
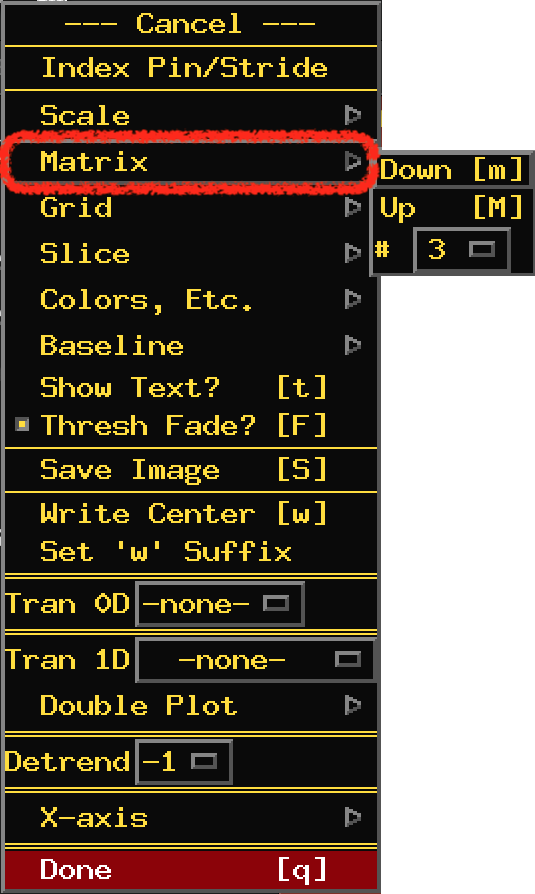
  • Link to all graph window keyboard shortcuts

../../_images/graph_window.png
  • If graph and image viewer in same slice orientation are both open, crosshairs in image window change to show a box containing dataset voxels being graphed

../../_images/graph_window_xhair_box.png
  • Central sub-graph (current focus location) is outlined in yellow

  • Current time index is marked with small red diamond on data graph

  • Left-clicking in a non-central sub-graph moves that location to focus. Making it the yellow center sub-graph and moving the crosshairs on the image window to match the new location.

  • Left-clicking in central sub-graph moves time index to nearest point

    • Can also use Index control in AFNI controller to change time

  • Right-clicking in any sub-graph pops up some statistics of its data

../../_images/graph_window_stats.png
  • Left-clicking the icon in the lower left corner causes icon and menu buttons to disappear.

  • Useful if you want to do a screenshot to save AFNI window(s)

  • Left-clicking in same place will bring icon and buttons back

../../_images/graph_window_clear.png

Opt Menu

  • Opt menu buttons let you control how graphs appear

  • Many items have keyboard shortcuts

  • Make sure you are typing into the correct window!

  • (XQuartz on macOS makes the button difficult to read…)

../../_images/graph_window_opt_open_short.png

Index Pin/Stride

  • Index Pin/Stride changes which data points are displayed in the graph. Useful when switching between datasets of different lengths. (note to staff: this is not in the gui button help)

    ../../_images/graph_window_opt_index_pin.png
  • The defaults (0, 0, 1) show all data points in the dataset.

  • Bot... sets which data point is the first (on the left)

  • Top... sets which data point is the last (on the right)

    • The number displayed will be your choosen number - 1

  • Stride sets the interval of data points displayed.

    • This number will auto correct to fit your other choices.

  • For example, if the data has 151 time points, setting Bot... = 10, Top... = 100, Stride = 9 will get you a graph that shows every 9th data point from the 10th to the 99th.

    ../../_images/graph_window_opt_index_pin_zoom.png
../../_images/graph_window_opt_index_pin_select.png

Scale

  • Scale changes scale of graphs.

    Mapping from voxel values to screen pixels.

  • Down [-] and Up [+] shrinks or expands the graphs vertically.

  • Choose lets you pick exact scale factor.

    ../../_images/graph_window_opt_scale_choose.png
    • Positive (pix/datum) = number of y screen pixels for each change of 1 in data.

    • Negative (datum/pix) = size of change in data to get 1 y screen pixel.

  • Auto [a] makes AFNI pick a nice scale factor (this one time)

  • AUTO [A] autoscale the graphs (every time they are redrawn)

  • Scale factor does not change when you resize graph,change matrix, etc. You usually have to auto-scale [a] or [A] afterwards.

  • Current scale factor is shown below graphs:

    ../../_images/graph_window_opt_scale_zoom.png
../../_images/graph_window_opt_scale.png

Matrix

  • Matrix changes number of sub-graphs across each row and column.

  • Down [m] and Up [M] decrease and increase number.

  • # lets you pick number exactly with allowable matrix sizes between 1 and 21

../../_images/graph_window_opt_matrix.png

Grid

  • Grid lets you change spacing of vertical grid lines (yellow in color by default).

  • Useful for showing regular timing interval (e.g., block timings)

  • Down [g] and Up [G] decrease and increase the spacing.

  • AutoGrid lets AFNI choose something reasonable (default)

  • Choose lets you pick the number exactly.

../../_images/graph_window_opt_grid_choose.png
  • HorZ [h] will put in a dashed line at the y = 0 level in sub-graphs.

    • Only useful if data range spans negative and positive values!

  • Current grid spacing is shown below graphs.

    ../../_images/graph_window_opt_grid_zoom.png
../../_images/graph_window_opt_grid.png

Slice

  • Slice lets you change slices

  • Down[z] and Up[Z] move one slice

  • Can also choose slice directly from menu

  • Current voxel indexes are shown below graphs:

    ../../_images/graph_window_opt_slice_zoom.png
  • Corresponds to [Voxel Coords?] display in AFNI controller (from Define DatamodeMisc menu see here)

../../_images/graph_window_opt_slice.png

Colors, Etc.

  • Colors, Etc. lets you alter the colors/lines used for drawing.

  • Lines used for sub-graph frame boxes, grid lines, data graphs, FIM orts/ideals, and double plots can have color changes and be made thicker.

    • Grid color is also used to highlight central sub-graph.

  • Can choose to graph curves as lines, points, or both together

  • Can change color of background and text

  • Can change gap between sub-graph boxes

  • Play with it and see what you can make!

../../_images/graph_window_opt_colors.png

Baseline

  • Baseline [b] changes how the sub-graphs are plotted.

  • All sub-graphs have same scale factor, to convert values into vertical pixels.

  • Baseline is value that gets plotted to bottom of sub-graph.

  • Individual: all sub-graphs have different baselines

    • Baseline = smallest value in each displayed time series

    • This can be confusing; same vertical location doesn’t mean same value

    • Shown below graphs as Base: separate

  • Common: all sub-graphs shown at any one time get same baseline

    • Baseline = smallest value in all displayed time series

    • Shown below graphs as Base: common

    • May need to rescale [a] after changing baseline

  • Global: all sub-graphs get same baseline even when spatial position changes

    • Default global level is smallest value in entire dataset

    • Set from [Baseline][Set Global] menu item

    ../../_images/graph_window_opt_baseline_set_global.png
  • Range of central sub-graph is shown to left of graph region

    • Central sub-graph bottom (baseline) value is shown at lower left

    • Upper left shows value at top of central sub-graph box

    • Number in [brackets] shows data range of one sub-graph box’s height

    • If baselines are separate, bot/top values only apply to central sub-graph.

  • Baseline mode is displayed at the bottom of the graph window.

    ../../_images/graph_window_opt_baseline_highlight.png
../../_images/graph_window_opt_baseline.png

Show Text?

  • Show Text? [t] allows you to see text display of values instead of graphs.

  • The number shown will be the numerical value at that voxel for the current time index.

  • The display at the bottom of the graph will show info for the central sub-graph. In the below example, the values are:

    • indx=13 [#14] is the current time index (and sub-brik).

    • val=261 is the numerical value of the voxel at the central sub-graph.

    • @t=29.15151 is the time value calculated from the TR of the dataset. (provided there is a TR in the dataset header information).

    ../../_images/graph_window_opt_show_text_plot.png
../../_images/graph_window_opt_show_text.png

Thresh Fade?

  • Thresh Fade? [F] marks sub-graphs of those voxels that are below threshold. (note to staff: this is not in the gui button help)

  • Those sub-graphs for voxels that are un-colored when See Overlay is turned on will be greyed out.

  • Fading is only on when See Overlay is on and with Clusterize and InstaCorr.

  • If Fading is on, there is an indicator at the bottom of the graph window.

  • The sub-plots are data from the underlay with fading from the thresholded overlay.

  • The red and blue text in the sub-graphs in the below example are just for emphasis…

    ../../_images/graph_window_opt_thresh_fade_graph.png
    ../../_images/graph_window_opt_thresh_fade_image.png ../../_images/graph_window_opt_thresh_fade_image_zoom2.png
../../_images/graph_window_opt_thresh_fade.png

Save Image

  • Save Image [S] lets you save a snapshot of the graph window to an image file.

    ../../_images/graph_window_opt_save_image_dialog.png
  • The image will be saved into your current directory. (where you started afni)

  • If you don’t provide an extension (.jpg or .png), the image will be saved as a .ppm file (Portable Pixmap Format).

    • If you use .jpeg as the extension, you will still get .ppm

../../_images/graph_window_opt_save_image.png

Write Center

  • Write Center [w] lets you write data from central sub-graph to a file.

  • The file is in ASCII format that can be imported into other programs

  • The filename is of the form xxx_yyy_zzz.suffix.1D (using voxel indexes)

  • The Set 'w' Suffix dialog lets you add text after the xxx_yyy_zzz and before the .1D file extension separated by ..

  • For example if you set your suffix as my_data, and the central sub-graph is at the voxel coordinates x=50, y=100, z=150, the file name will be 050_100_150.my_data.1D

  • Write Center will overwrite a file with the same name if it exists in the same directory. So use the set suffix to make sure you don’t lose any data.

  • Once you choose your suffix you will not be able to remove the suffix, only change it to something else (note to staff: may need to fix this)

    ../../_images/graph_window_opt_write_center_suffix.png
../../_images/graph_window_opt_write_center.png

Tran 0D

  • Tran 0D lets you transform the data before it is graphed.

  • The chosen function is applied to each point in the time series.

  • Log10 and SSqrt useful for images with extreme values.

  • The below images are before and after a Log10 transformation.

    ../../_images/graph_window_opt_tran_0D_raw.png ../../_images/graph_window_opt_tran_0D_log10.png
../../_images/graph_window_opt_tran_0D.png

Tran 1D

  • Tran 1D lets you transform the data before it is graphed.

  • The chosen function is applied to the time series as a whole.

  • You can combine the 0D and 1D transformations if you want to get fancy.

  • Below is the raw data as above with the AdptMean19 transformation. (XQuartz on macOS obscures the text a bit in the lower right corner)

    ../../_images/graph_window_opt_tran_1D_AdptMean19.png
  • Note to staff: Lots of stuff here. How much detail do we want? Is there a good place with documentation? Should we break this section out?

../../_images/graph_window_opt_tran_1D.png

Double Plot

  • Double Plot lets you plot output of Tran 1D and original data together.

  • Tran 1D must be active to see the transformed data along with the original time series data.

  • Below is the data with Tran 0D set to Log10 and Tran 1D set to AdptMean19 and DPlot On.

  • You can always change the colors with the Colors, Etc. option above. (see here)

    ../../_images/graph_window_opt_tran_0D_log10_1D_AdptMean19.png
../../_images/graph_window_opt_double_plot.png

Detrend

  • Detrend changes the order of the time series L1 detrending / baseline removal.

  • -1 is for NO detrending (default).

    ../../_images/graph_window_opt_tran_0D_log10_1D_AdptMean19.png
../../_images/graph_window_opt_Detrend.png

X-axis

  • X-axis lets you choose how graph x-axis is chosen

  • The default is linear time.

  • Useful only in very limited circumstances!

  • Below is the same data with X-axis=center (not really sure that is useful with this data…)

    ../../_images/graph_window_opt_Xaxis_center.png
../../_images/graph_window_opt_Xaxis.png

Jump within GUI Guide

Starting

Main controller

Image window

Graph window

Overlay panel

Datamode panel

Chooser menu

Maps