5.1.5. AFNI GUI: Overlay panel

Define Overlay

  • Click the Define OverLay -> button to open the overlay panel. This will control the thresholds, colors, etc. for overlays.

  • You usually want to have the See OverLay button checked.

  • When you choose an overlay dataset, this panel should automatically open, check the See OverLay button, and select some reasonable sub-bricks for the OLay and Thr.

  • For this guide we will load a stats dataset from the output of afni_proc.py.

../../_images/overlay_full_start.png

Select sub-bricks

  • ULay or OLay will let you choose which sub-brick of the underlay or overlay datasets to display.

  • It is usually good to start here before adjusting any other options.

  • The sub-brick labels are assigned when the dataset is created. The index values show the numerical location of the sub-brick in the dataset (starting at 0 of course).

  • The Thr allows you to choose the sub-brick of the overlay dataset with which to threshold the Olay sub-brick.

  • In this example the “Coef” is the overlay and is thresholded by the “Tstat”.

  • Pro tip: if you have a lot of sub-bricks for any of the ULay, OLay or Thr datasets, the list can be quite large and clunky when you left-click on menu to pick one; instead, you can right-click on the label itself (Ulay, etc.) to open up a scrollable menu.

../../_images/overlay_main_ulay_olay_thr.png

Ranges

  • ULay, OLay, and Thr show the range of values for each of those sub-bricks. These are the range of the raw values in each of the 3D datasets. The overlay values may be useful for choosing the range for the pbar.

    • If a dataset is warped from a ‘parent’, these statistics are taken from the parent dataset.

  • autoRange determines whether the program or the user sets the OLay value that maps to the color pbar level 1.0.

    • Selected: uses the autoRange value for pbar 1.0. (default)

    • Not selected: allows the user to control the Range value with the value box below.

  • % determines whether the slider sets the threshold based on percentile, rather than value. At 0.75, you threshold away the bottom 75% of the voxels that would be displayed with no thresholding at all. At 0.5, you see the top half. The slider power is ignored in percentile mode, so 0.5 is the same as 5, 50, etc. Zero voxels are not considered if Pos? is set (under the color bar). Otherwise, the cumulative distribution percentages come from the absolute value of the voxel values.

  • The value box below autoRange is greyed out if autoRange is enabled. Otherwise you can use the arrows to change the value or just type in a number that will map to pbar level 1.0. (negative numbers auto correct to 0).

  • The arrows for Rota will rotate the colors on the ‘pbar’ up or down. (Press with Shift to rotate in steps of 4)

  • F will flip the color bar Top-to-Bottom. This works for the continuous color scale and discretely panned color bars.

../../_images/overlay_main_ranges.png

Color Bar

  • The color bar represents the color that maps to the overlay data.

  • The number in the top and bottom right (in this case 4.168 and -4.168. The bottom number is out of view because of XQuartz) corresponds to the range selected (in this case autoRange is selected). If you were to de-select autoRange and enter a number, that number would be represented here.

  • Left clicking in the color bar will flip the colors top to bottom.

  • The # drop down menu lets you subdivide the color bar into panes by the selected number. The default ** is a continuous color bar.

  • Pos? is de-selected by default to show positive and negative values. If you select Pos? only positive overlay values will be shown. The range of the color bar will start at 0, so the color mapping will change accordingly. Zero overlay values are never overlaid.

../../_images/overlay_main_color_bar.png
  • There is a hidden menu if you right click in the color bar. The value displayed is the value at the vertical location at which you right clicked. The RGB is the numerical representation of the color at that point from 0 to 255 for red, green, and blue (helpful if you want to color match in a figure).

    ../../_images/overlay_main_color_bar_hidden.png
  • Clicking Choose Colorscale will open a popup menu with lots of choices of different color bars. I believe that Reds_and_Blues_Inv is the default, but play with the different choices to see what you like. There are discrete integer scales that are good for atlases or region of interest maps.

  • More on color bars in AFNI here.

../../_images/overlay_main_color_bar_Choose_Colorscale.png

Threshold Slider

  • Drag the slider bar to adjust the threshold for the overlay display. You can left click above or below the slider to jump up or down by the 3rd digit value (just try it).

    • Threshold doesn’t apply if the dataset is RGB-format. (I have never seen one of these datasets…)

    • Threshold applies to the Thr sub-brick.

  • The value shown to the left of the slider is between 0 and 1 (modified by a power of 10 as explained below).

../../_images/overlay_main_thr_slider.png

p q 10^

  • The p= displays the estimated significance (p-value) of the threshold slider if possible. This is the ‘uncorrected’ or per-voxel value of ‘p’. (This will display ‘[NA]’ if not possible)

  • p values displayed as 1.2-7 are shorthand for 1.2 x 10^(-7).

  • q=: if FDR curves are pre-computed in the dataset header, then the False Discovery Rate q value will also be shown. FDR q is the estimate of above-threshold voxels that are false detections (‘false positives’).

    • You can add FDR curves to a dataset with 3drefit -addFDR or by using the Add FDR Curves button in the hidden popup menu under the label atop the threshold slider (shown below).

  • The 10^ drop down sets the power-of-10 range of the threshold slider. If it is set to 1 (default in most cases), the slider range will be ~0.0 to ~10.0. If it is set to 0, the range is ~0.0 to ~1.0, etc. The color bar is mapped to the slider range by the autoRange or manually chosen range.

  • If you hover over the p= or q=, you will get a popup hint that displays some stats.

    ../../_images/overlay_main_p_q_10_pval_hover.png
    • The Uncorrected p= is the same value displayed in the gui but with more digits.

    • The alpha(p)= is the approximate likelihood that the p value shown results from the null hypothesis, not the alternative.

    • FDR q= is the same as the gui but with more digits.

    • MDF= is a CRUDE estimate of the true positive voxels that are below the current threshold (‘false negatives’).

  • If you put the cursor over the p or q area and use the scroll wheel (or 2 finger swipe on the track pad) to scroll down, you will get a popup dialog to let you enter the p value you want directly. If you scroll up, you will get a dialog to set the q value.

    ../../_images/overlay_main_p_q_10_scroll_down.png ../../_images/overlay_main_p_q_10_scroll_up.png
../../_images/overlay_main_p_q_10.png

Hidden Threshold Menu

  • There is a hidden menu that appears if you right click and hold in the p or q area. This menu also appears if you right click and hold on the Thr label atop the threshold slider.

../../_images/overlay_main_thr_hidden.png
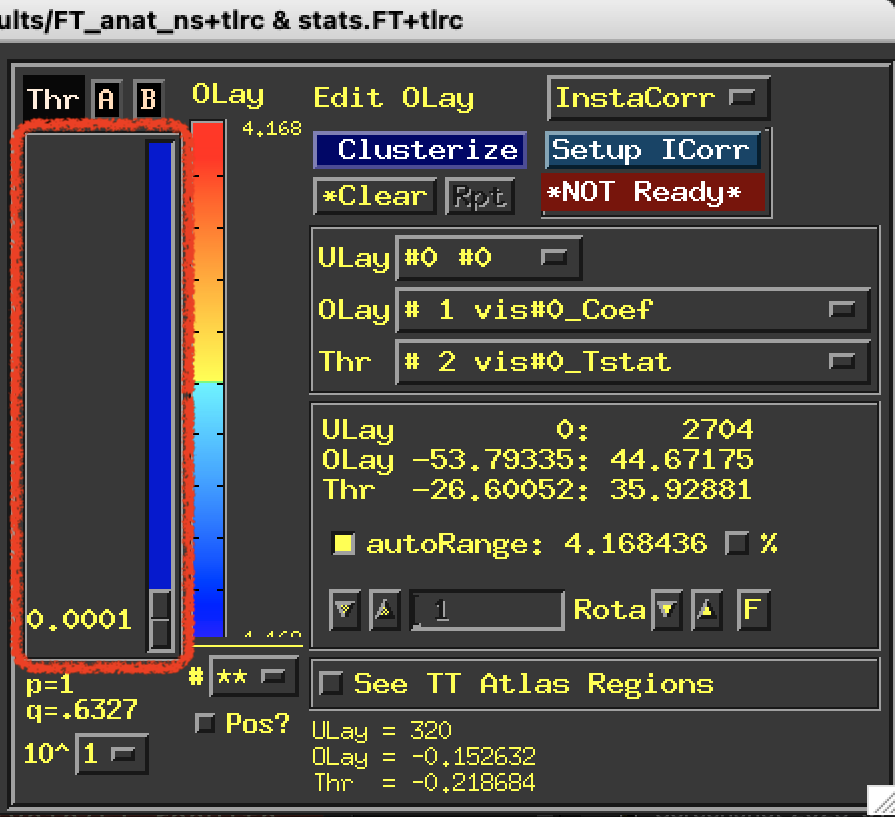
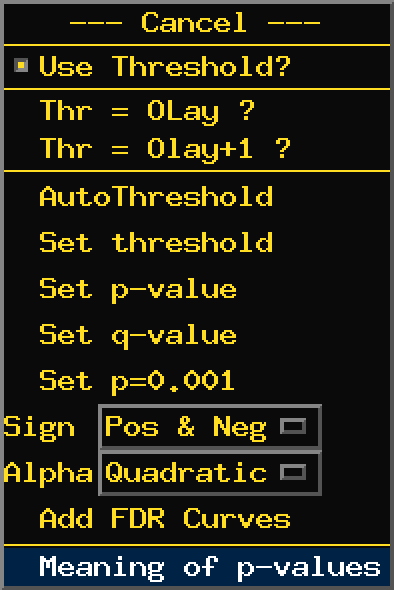
  • Use Threshold? is selected by default. If you deselect it, the threshold slider will do nothing and you will get NO thresholding at all.

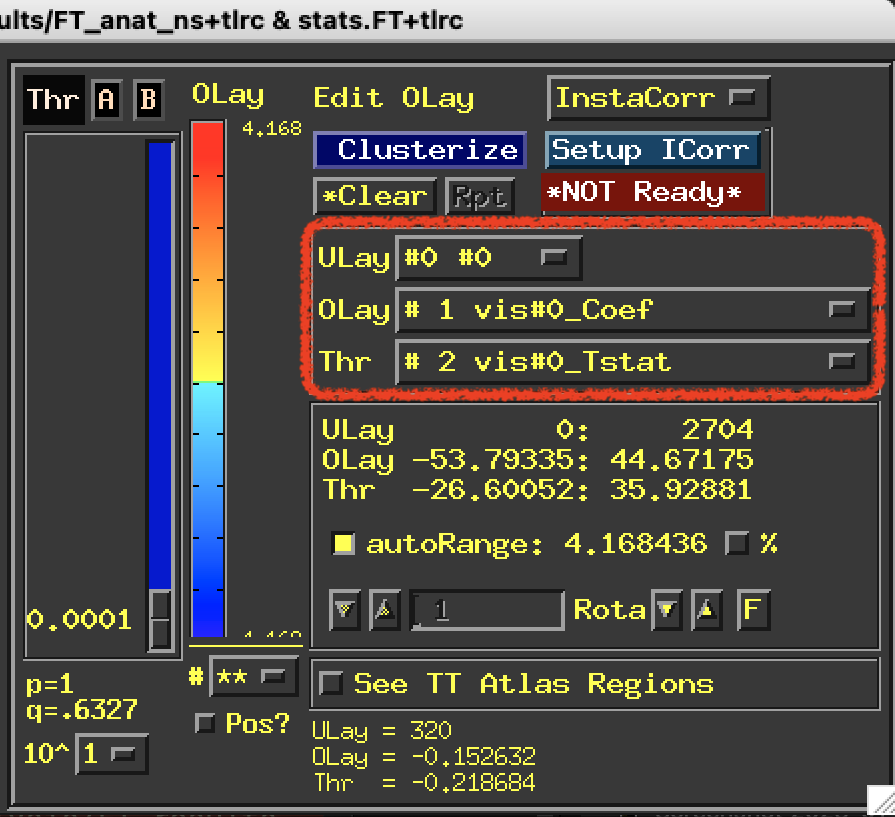
  • Thr = OLay ? sets the Thr sub-brick to be the same as the OLay sub-brick. This is useful for looking at full F-stats or anova’s etc.

  • Thr = Olay+1 ? (note to staff: capitalization is wrong here) sets the Thr sub-brick to be the next sub-brick after the OLay that is selected. This is useful for t-tests or anything with a coefficient and a T-stat.

  • AutoThreshold: the threshold is selected as 0.5*median of the upper 65% of the positive values in the volume. If it’s a statistic, then the threshold is the square root of the value that corresponds to 0.001 and that AutoThreshold value.

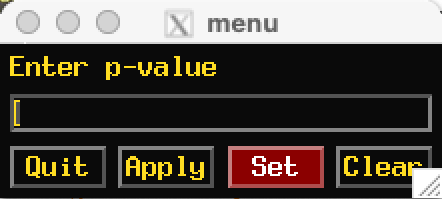
  • Set threshold pops up a dialog allowing you to enter a number directly. It will modify the 10^ selection to match the number you enter. If you enter a negative number, the threshold slider will flash and there will be an annoying beep tone.

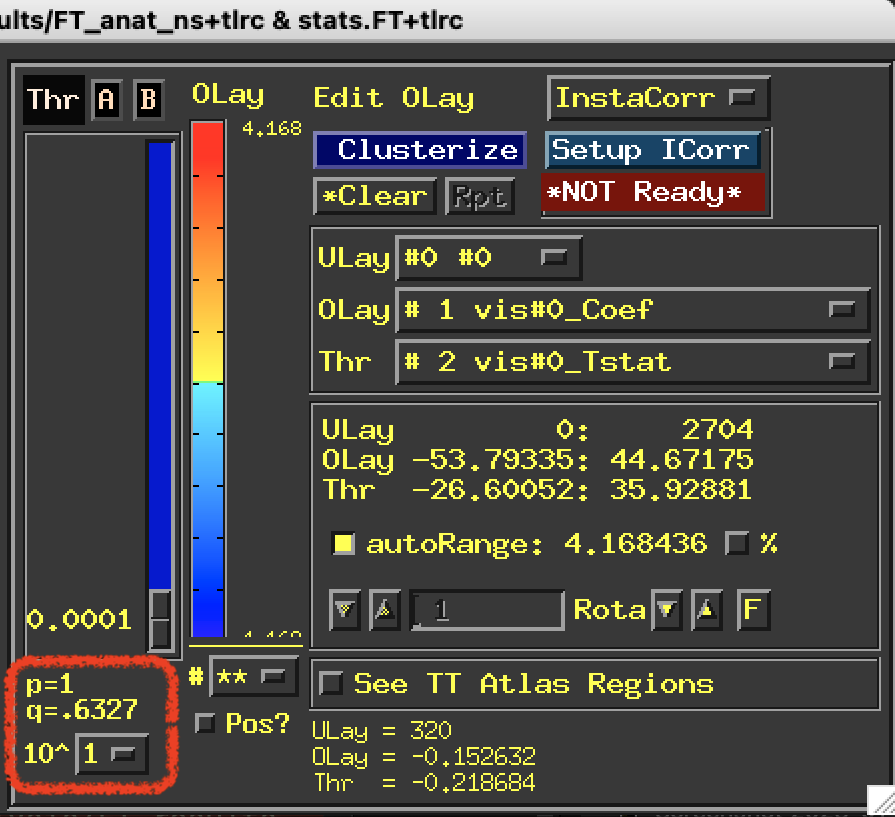
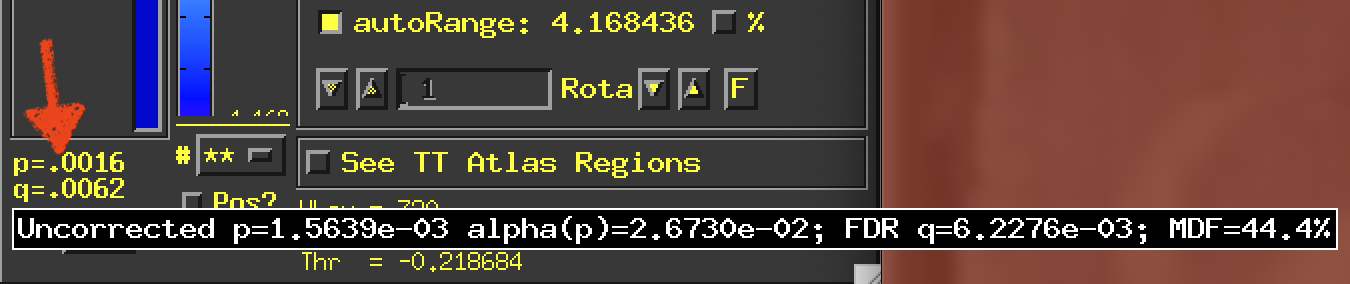
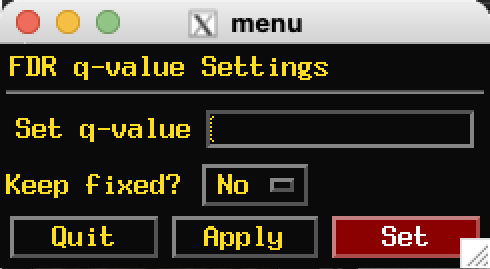
  • Set p-value and Set q-value will give you the same dialog boxes as shown above with the scrolling actions.

  • Set p=0.001 does what it says… Just quicker than messing with the slider.

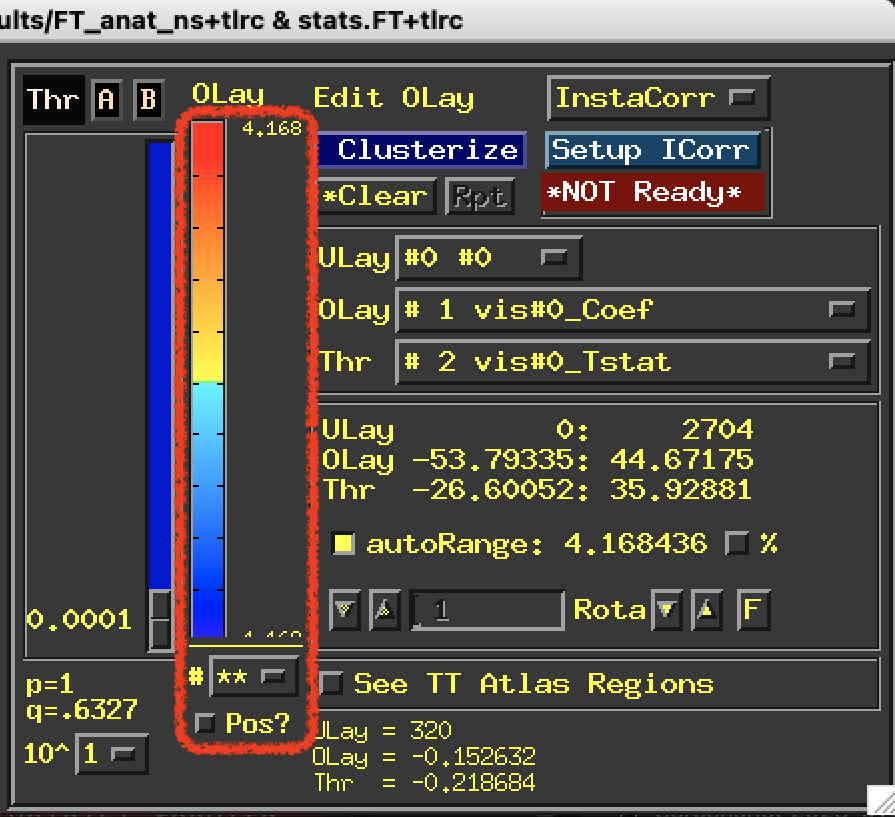
  • Sign gives you 3 options. The default is Pos & Neg. Pos only hides all of the negative values, but keeps the color scale unchanged. This differs from the Pos? button in that the Pos? button will rescale the colors so that ~0.0 is the bottom of the color bar. Neg only hides all of the positive values but keeps the color scale unchanged. These choices interact with the Pos? button. So if you have Pos? selected, then choose Neg only you will hide everything. Pos? selected with Pos only or Pos & Neg is the same as Pos?.

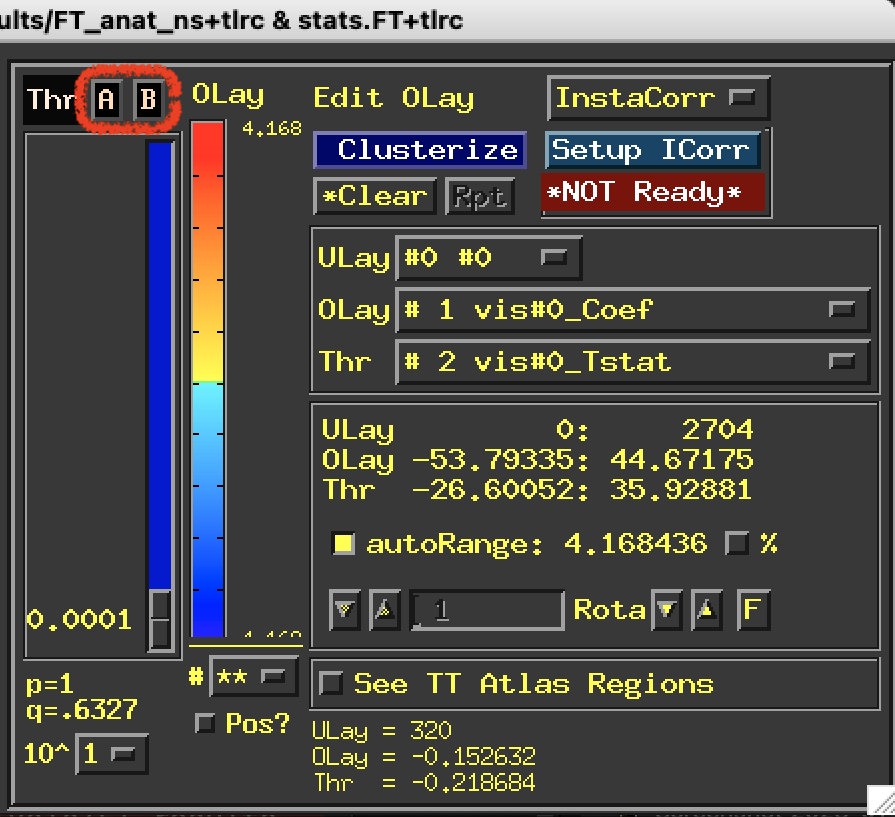
  • Alpha changes the A button color fading method.

  • Add FDR Curves computes FDR curves for the OLay statistical sub-bricks. (same as 3drefit -addFDR)

  • Meaning of p-values will open a text window explaining a bit… The same text is here.

afniandafni/gui_guide/media/overlay_main_thr_hidden_menu.png

Hidden OLay Menu

  • There is a hidden menu that appears if you right click and hold in the OLay or Edit OLay area. This area is above the color bar and extends to the area above the Clusterize button.

../../_images/overlay_main_OLay_edit_hidden.png
  • Set OLay range = 1 is a shortcut for deselecting autoRange and entering 1 in the range box.

  • Equalize Spacing only applies if you have chosen multiple color panes with the # menu. Then it will make all panes an equal size.

  • Flip Colors is the same as left clicking the color bar or pushing the F button.

  • Jumpto OLay Max @Thr and Jumpto OLay Min @Thr will jump to the voxel location in the OLay with the max or min value given the current threshold settings. These are greyed out if there is no threshold set. note to staff: typo in menu and hover text

  • Save pbar to image will pop up a dialog box allowing you to give a file name for an exported image of the color bar. This image file will be saved in your current directory. Using identical names will overwrite the file with no warning.

  • Read in palette will open a file chooser window allowing you to choose a .pal file to load. This file should be a plain text file with a title and color values in hex or rgb format. More info on how to make one here. Also this may be helpful: MakeColorMap.

  • Write out palette will save your current color map to a .pal file in your current directory. Using identical names will append the current color bar to the previous. This is bad.

  • Show Palette Table will pop up a window with color names and hex values (sometimes text). This might be useful in making your own color palettes.

  • Tran 0D and Tran 2D are the same functions in the Disp menu in the image window. See here.

../../_images/overlay_main_olay_hidden.png

Jump within GUI Guide

Starting

Main controller

Image window

Graph window

Overlay panel

Datamode panel

Chooser menu

Maps