5.1.2. AFNI GUI: Main controller

AFNI GUI: Main controller

../../_images/afni_controller_window.png

Load underlay/overlay datasets

  • An Image Window may have opened when afni was launched. (If not, you can open an image window by clicking Image next to Axial, Sagittal, or Coronal; see here ).

  • UnderLay chooses which 3D dataset to view as the background (grayscale).

    • Current underlay dataset determines the resolution of and 3D region covered by image viewers.

    • anatomical or time series datasets usually go here.

    • Datasets which can be graphed are marked with a * after their names.

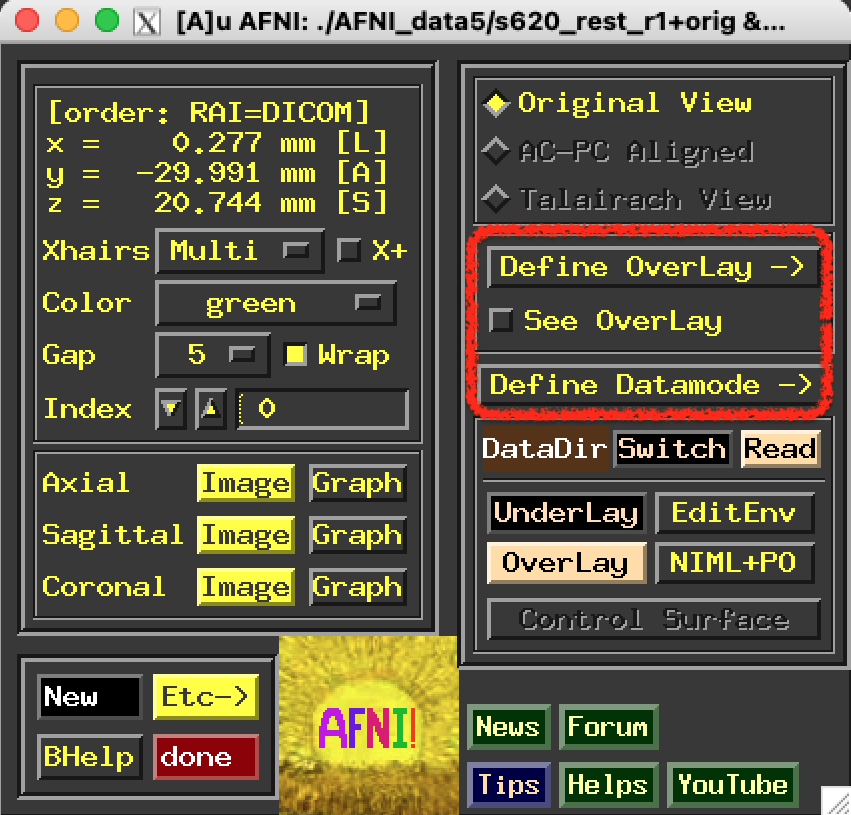
  • OverLay Use this to choose which overlay (color) 3D dataset to view.

    • Functional (statistical) dataset usually goes here.

    • Functional datasets will be interpolated to the underlay resolution, and flipped to that orientation (if needed).

      • The Define Datamode panel controls the interpolation method (see here).

  • Both buttons open a dataset chooser window (see here).

  • Datasets that are compressed have a z after their names.

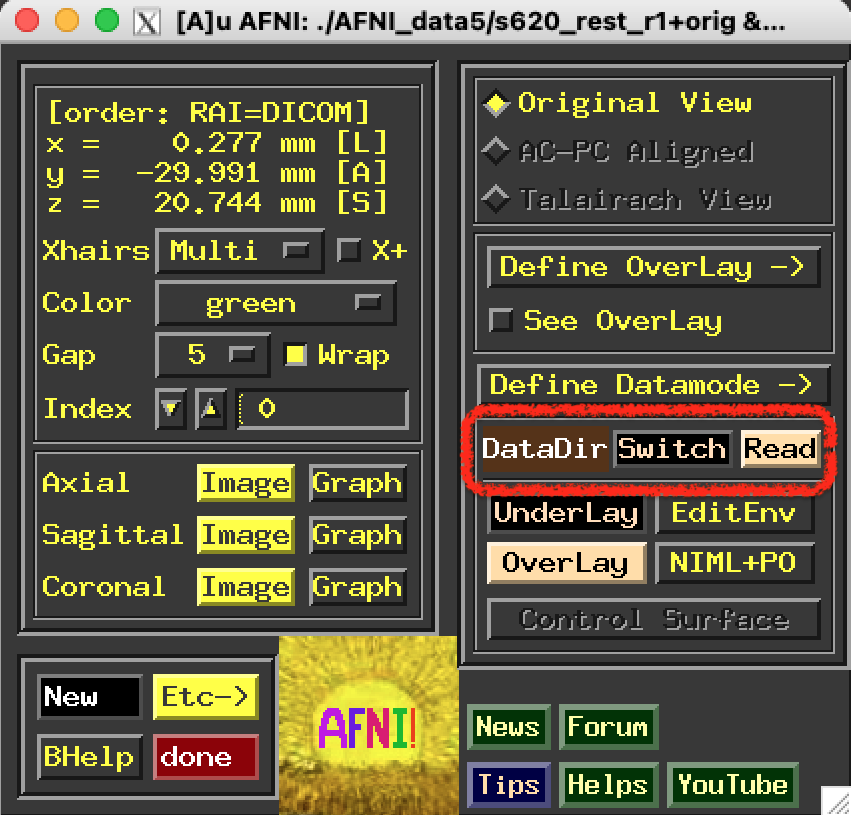
  • Datasets available are from the current session.

  • If new datasets have been added to the current session directory, afni will rescan the directory and popup a little message.

  • See here for more information on the Image Window.

../../_images/afni_controller_window_under_over_lay.png

1st column

Coordinate Display

  • The xyz-coordinate display in upper left corner shows current focus location.

  • By default, the coordinates are in RAI order (from the DICOM standard):

    • x = Right (negative) to Left (positive)

    • y = Anterior (negative) to Posterior (positive)

    • z = Inferior (negative) to Superior (positive)

  • This display order can be changed to the neuroscience imaging order LPI:

    • x = Left (negative) to Right (positive)

    • y = Posterior (negative) to Anterior (positive)

    • z = Inferior (negative) to Superior (positive)

    • Right-click in coordinate display to change the coordinate order

../../_images/afni_controller_window_xyz.png

Xhairs

  • Xhairs: Type of crosshairs

    • Off: no display of crosshairs

    • Single: display of single crosshairs

    • Multi: display of crosshairs for each slice in the ‘montage’ layouts

    • LR+AP: display crosshairs only parallel to the L-R and A-P axes (etc.)

  • X+: Montage will show the crosshairs in all slices or just one slice.

  • Color: Change the color of crosshairs to make it more visible with certain image overlays.

  • Gap: Size of gap (in voxels) at the center of the crosshairs.

  • Wrap: Montage layout wraps around when the slices go past an edge of the dataset.

../../_images/afni_controller_window_xhairs.png

Index

  • Index: Time index

    • Controls the time index of the images being viewed.

    • Controls the underlay image only.

    • Only available for images that have multiple subbricks (usually for time).

    • Increment or decrement with the arrows or just type in the number.

    • Right click on Index for a menu of extra options.

../../_images/afni_controller_window_index.png

Image and Graph

  • Image and Graph buttons for the adjacent views (Axial, Sagittal, Coronal).

    • Normal: button opens a viewing window.

    • Inverted: button raises opened window.

    • Right-click on an inverted button ‘fetches’ the image / graph window.

  • N.B.: AFNI does not read datasets from disk until a window is opened.

  • This can make opening the first viewing window be quite slow

  • Graph buttons are only enabled for datasets that are viewing their data files directly.

    • Not warping on demand – see the top of the Define Datamode control panel (see here).

../../_images/afni_controller_window_image_graph.png

BHelp

  • BHelp button: when pressed, the cursor changes to a hand shape.

    • Use it to click on any AFNI button and you will get a small help popup (and click on it when done, to close).

    • AFNI also has ‘hints’ (AKA ‘tooltips’).

  • Press the done button twice within 5 seconds to exit AFNI.

    • The first button press changes done to DONE.

    • Fail to press second time in 5 seconds: it changes back to done.

    • Don’t press a mouse button in the blank square to the right of done. We won’t be responsible for the consequences.

../../_images/afni_controller_window_bhelp_done.png

2nd column

Views

  • Use these to select the type of view for your data. Need more here.

    • Original View

    • AC-PC Aligned

    • Talairach View

    • notes on why these are sometimes greyed out.

../../_images/afni_controller_window_view.png

Overlay and Datamode

  • Define Overlay ->: Use this to control the thresholds, colors, etc. for overlays.

  • See Overlay: Show / Hide the overlay dataset.

    • This is useful for seeing what anatomical features are ‘under’ a particular overlay color.

  • Define Datamode Use this to control the mode in which the underlay data is viewed, and also to save 3D datasets to disk.

../../_images/afni_controller_window_overlay_datamode.png

DataDir, Switch and Read

  • Switch Use this to choose from which session 3D datasets may be viewed.

    • All datasets in same directory are assumed to be aligned in space.

      • this is in the handout, but I don’t think it is true…

    • Any dataset can be the underlay; any dataset can be the overlay.

  • Read Click this button to get a ‘chooser’ dialog window to select a new directory from which to read datasets.

    • This will add a new ‘session’ that you can select with the Switch button.

../../_images/afni_controller_window_DataDir.png

EditEnv and NIML+PO

  • EditEnv need more here.

  • NIML+PO: Start listening for NIML and Plugout TCP/IP (network sockets) need more here.

    • Expecting AFNI to talk to suma and/or plugout_drive.

    • Like running afni -niml -yesplugouts on the command line.

    • Greyed out if already listening (you already pushed it or launched afni with -niml -yesplugouts.

../../_images/afni_controller_window_env_niml.png

Control Surface

  • Control Surface: control the display of overlaid surfaces in the image viewers when talking with suma.

    • Surface nodes will have little boxes drawn, when they appear in a slice.

    • Surface triangles will have line segments drawn, where they intersect a slice center-plane.

    • Greyed out if suma is not running and talking with afni.

../../_images/afni_controller_window_cont_surf.png

News, Forum, Tips, Helps, YouTube

../../_images/afni_controller_window_news_etc.png

Jump within GUI Guide

Starting

Main controller

Image window

Graph window

Overlay panel

Datamode panel

Chooser menu

Maps