12.14.3. Examples of things with ROIs: resampling and clusterizing
Introduction
Download script: afni11_roi_cmds.tcsh
This demo accompanies the afni11*pdf presentation that is part of the AFNI Bootcamp.
Briefly, this describes was to both resample and use ROIs to extract values of interest from data: sometimes averaging within the ROI, sometimes extracting all voxel values.
Clusterizing is also performed on the command line. We also demonstrate using whereami` in conjunction with clusterizing: first, to identify in which ROI a voxel might be located (WRT some atlas); and second, what atlas regions a clusterized ROI overlaps with.
Examples of auto-imagemaking with @chauffeur_afni are also
provided (typically in the “hidden” code blocks).
An ROI is defined to be a set of voxels that have the same integer value. In general, these can include both positive and negative values.
A mask is a set of nonzero voxels, that is essentially binary; the distinction of individual voxel values is ignored, and it is essentially one giant ROI.
Note that sometimes the dset input with -mask .. will be treated
as a mask (the set of all nonzero voxels forms a single,
undifferentiated region) and sometimes as a map of ROIs (each set
of voxels of a given value will be treated separately). Please check
the help file carefully for correct usage.
#!/bin/tcsh

# AFNI demo: part of afni11*pdf talk about ROIs
#
# + last update: May 19, 2019
#
##########################################################################

# This script is meant to be run in the following directory of the
# AFNI Bootcamp demo data:
#     AFNI_data6/roi_demo
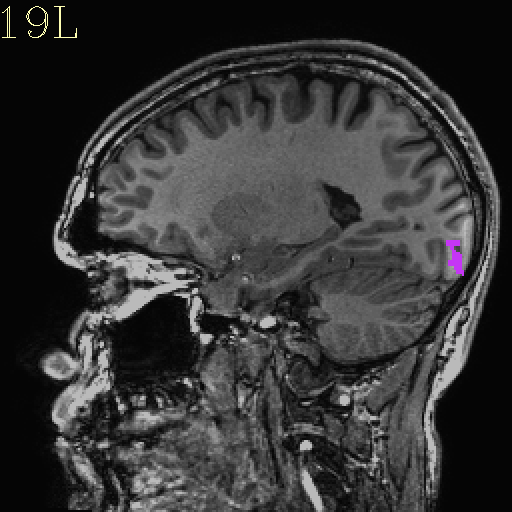
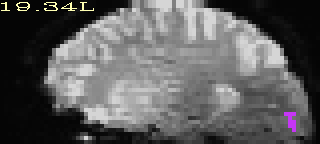
Resampling (regridding) ROIs
We start with an ROI in original anatomical (=high res) space.
We then resample the data, using the NN resampling mode to
preserve integer values.
# Change grid/resolution of data set from (high res) anat to
# (low res) EPI
3dresample                                                            \
    -overwrite                                                        \
    -master rall_vr+orig                                              \
    -prefix anat_roi_resam                                            \
    -inset anat_roi+orig                                              \
    -rmode NN
Original ROI |
Resampled ROI |
|---|---|
|
|
Averaging quantities within a mask
Calculate the average value of the voxels in the ROI, per time point,
and dump the result to a text file (via the redirect > operator;
otherwise, results are just shown in the terminal).
Note that any value >0 in the -mask .. dset would be recognized as
a single ROI here.
# Average within ROI mask, per volume
3dmaskave                                                             \
    -mask anat_roi_resam+orig                                         \
    -quiet                                                            \
    rall_vr+orig > epi_avg.1D
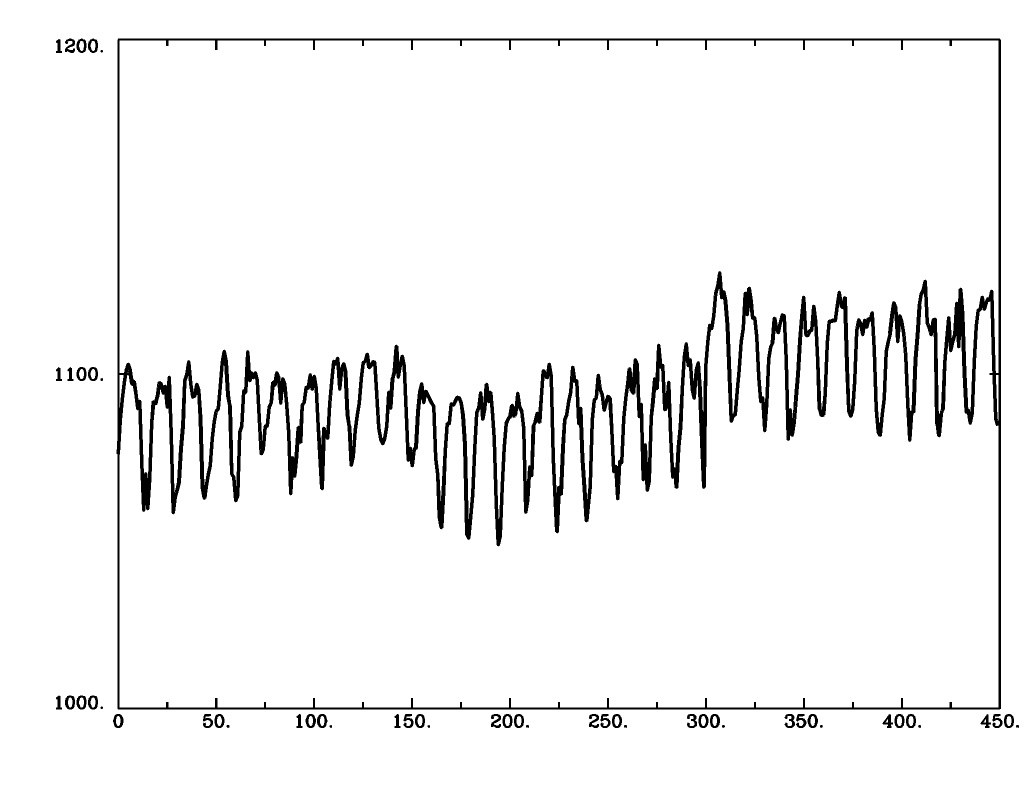
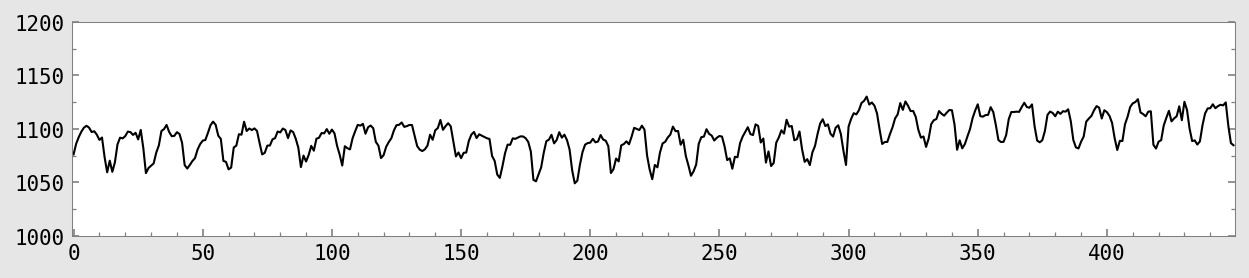
The following are ways to view the output time series, as numbers and/or plots:
# ... and view dumped text file results, just a column of numbers
cat epi_avg.1D

# Plot the time series (without the "-jpg ...", a GUI opens with the plot).
1dplot -jpg IMG_epi_avg -yaxis 1000:1200:2:1 epi_avg.1D

# ... and, if you have Python + matplotlib
1dplot.py -prefix IMG_epi_avg_py.jpg -yaxis 1000:1200 -infiles epi_avg.1D
Excerpt of text file:
1076.11
1086.11
1092.33
1097.33
1101.11
1102.89
1101.11
1097
1097.78
1094.56
1dplot version |
1dplot.py version |
|---|---|
|
|
Extracting individual voxel values within a mask
We could also dump the values of a dset’s voxels that reside within
a mask region into a text file. In the present example no coordinate
locations are saved in the file, but one could save the coordinates of
each voxel, too (as indices, by not including -noijk; or as
physical coors, by using -xyz):
# Save values of individual voxels within the ROI
3dmaskdump                                                            \
    -noijk                                                            \
    -mask anat_roi_resam+orig                                         \
    func_slim+orig'[2]' > Vrel-tstats.txt

# ... and view dumped text file results
cat Vrel-tstats.txt
leads to ->
33.15855
32.55156
37.3858
33.50882
34.89167
30.86979
30.49555
32.45002
29.77332
Calculating stats from separate ROIs
One might also have a dataset with multiple ROIs. Recall that each ROI is just defined by being a set of voxels with the same integer value. One can even have negative values of integers define an ROI.
The following program will calculate averages (or other statistical quantities) from a given dset within each ROI:
# Compute separate statistics for each ROI in a volume
3dROIstats                                                            \
    -mask 3rois+orig                                                  \
    func_slim+orig'[0]'                                               \
    > stats_3rois.txt

# ... and view dumped text file results
cat stats_3rois.txt
The information in “stats_3rois.txt” is displayed as a grid of headers/labels and data, but the columns might not always align, unfortunately:
File	Sub-brick	Mean_-1  	Mean_1  	Mean_2
func_slim+orig[0]	0[Full_Fsta]	10.805717	69.336539	71.333655
Note that running the same command with the -quiet option would
produce the same numbers, but without the text descriptions. That
might be more useful for scripting purposes.
Clusterizing, visualizing and extracting info about ROIs
A clusterizing example, using labels to specify stat and effect estimate volumes, and using a p-value (with bi-sided testing) to specify voxelwise threshold.
Bi-sided testing is similar to two-sided, with the additional constraint that positive and negative voxels cluster separately. (With just two-sided clustering, a single cluster could contain both positive and negative effects, which is probably not what most people would want for this process.)
Here, we have made up a volume threshold of 200 voxels– that could be calculated, for example, by 3dClustSim or something.
# Note the use of labels to specify relevant subbricks and the p-value
# to specify the voxelwise threshold.
3dClusterize                                                          \
    -overwrite                                                        \
    -1Dformat                                                         \
    -inset func_slim+orig                                             \
    -idat 'Vrel#0_Coef'                                               \
    -ithr 'Vrel#0_Tstat'                                              \
    -NN 2                                                             \
    -clust_nvox 200                                                   \
    -bisided p=0.0001                                                 \
    -pref_map Clust_map.nii.gz                                        \
    -pref_dat Clust_dat.nii.gz                                        \
    > Clust_report.1D
Beta values (top) and ROI maps (bottom) after clusterizing |
|---|
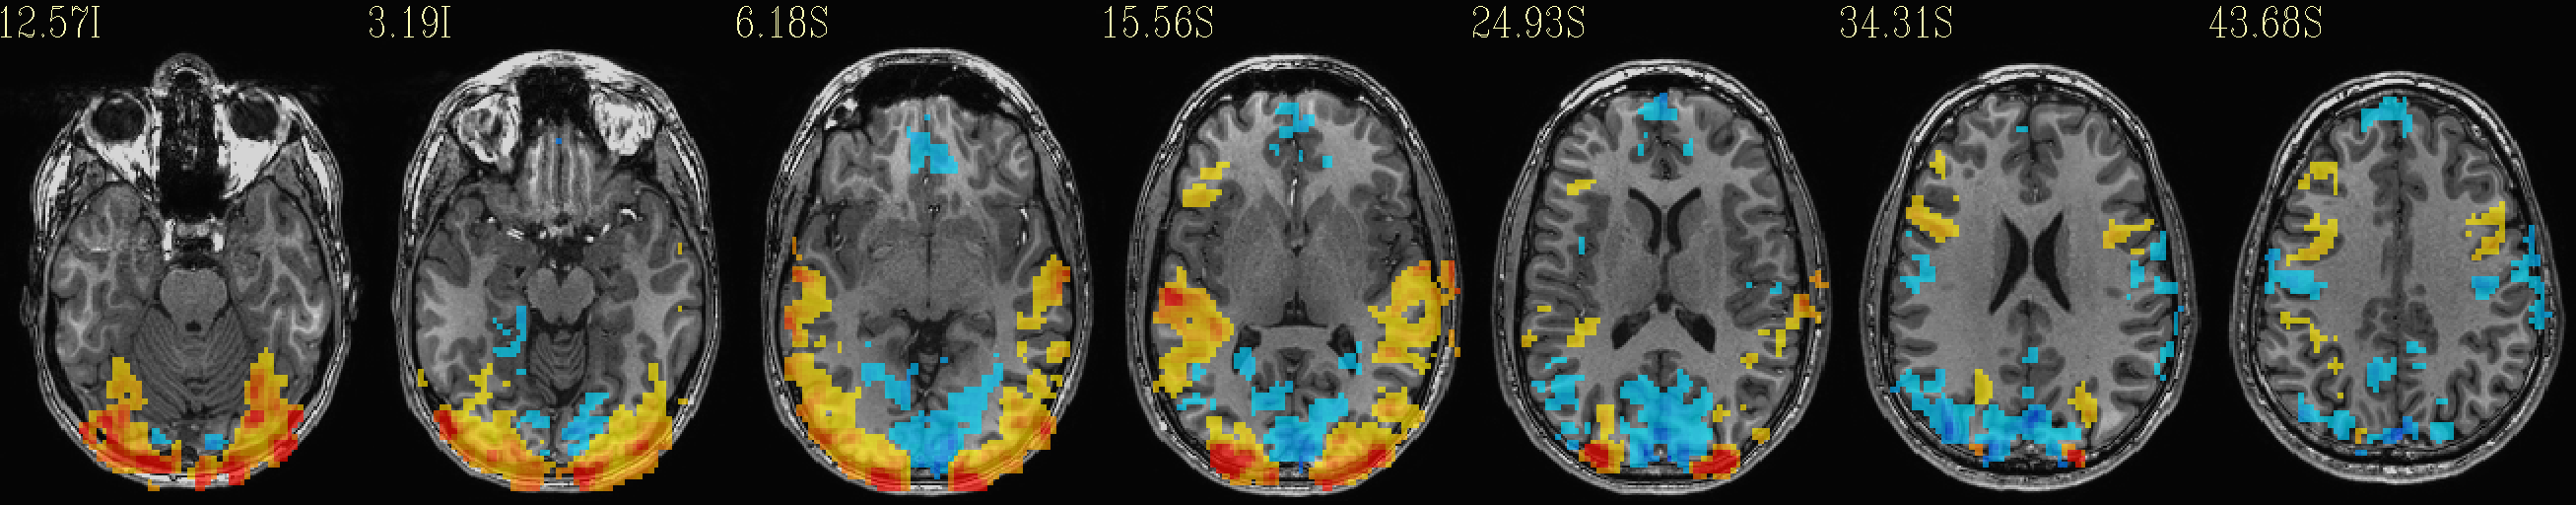
|
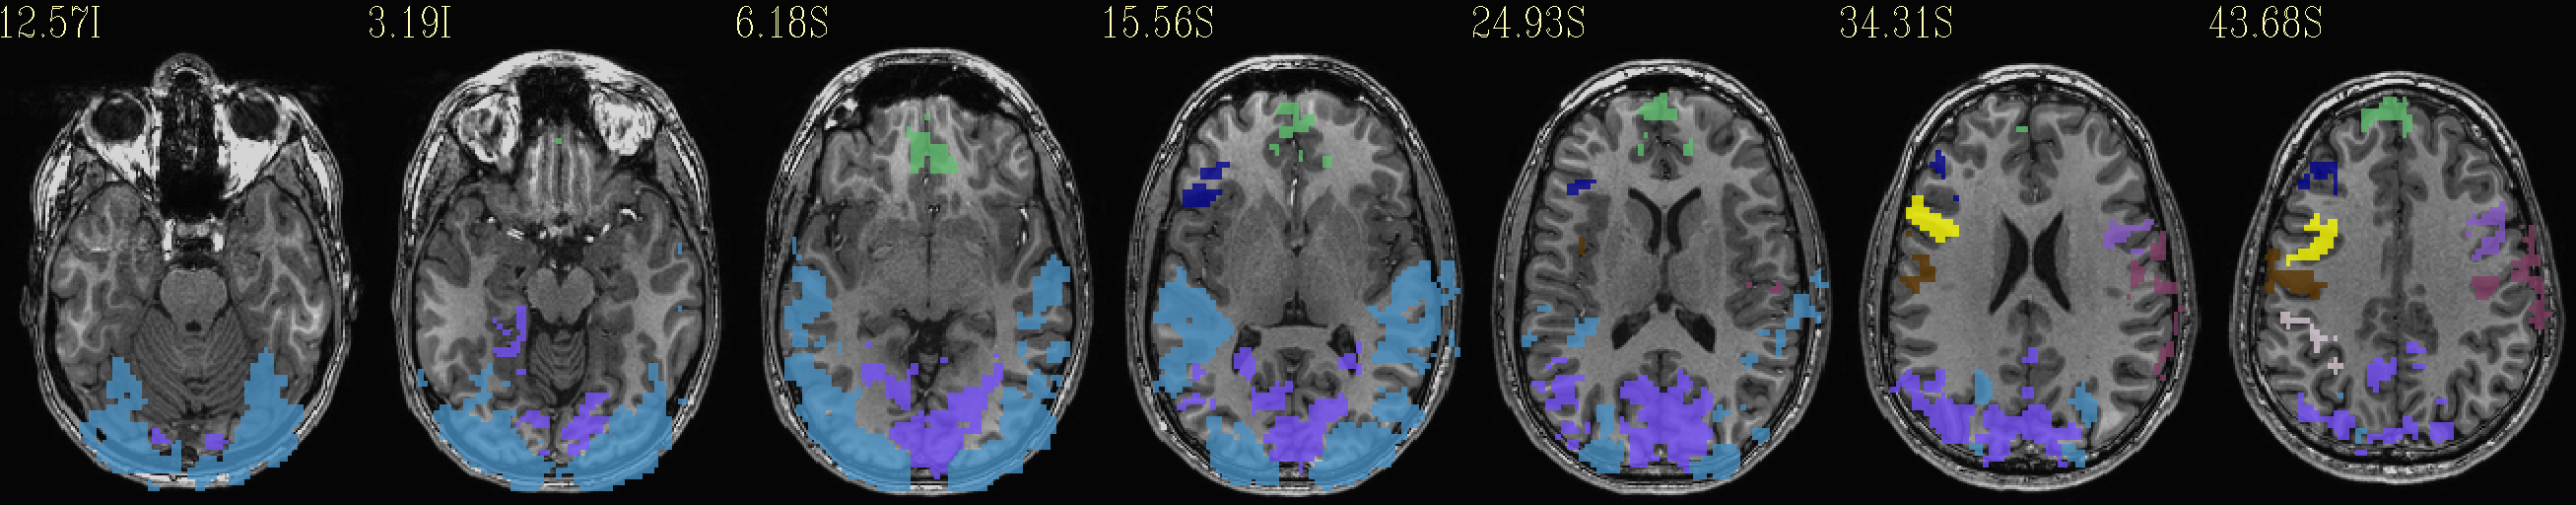
|
In this example, the text report of the results (= “cluster table”)
has also been saved, using the > redirect to dump it to a text file.
Here, it contains both the numerical information about clusters, as
well as text description and column headers in comments.
#
#  Cluster report
#[ Dataset prefix      = func_slim ]
#[ Threshold vol       = [2] 'Vrel#0_Tstat' ]
#[ Supplement dat vol  = [1] 'Vrel#0_Coef' ]
#[ Option summary      = -bisided,p=0.0001,clust_nvox,200,NN2 ]
#[ Threshold value(s)  = left-tail p=0.000100 -> stat=-3.927399;  right-tail p=0.000100 -> stat=3.927399 ]
#[ Aux. stat. info.    = DEGREES-of-FREEDOM : 430  ]
#[ Nvoxel threshold    = 200;  Volume threshold = 4537.500 ]
#[ Single voxel volume = 22.688 (microliters) ]
#[ Neighbor type, NN   = 2 ]
#[ Voxel datum type    = short ]
#[ Voxel dimensions    = 2.750 mm X 2.750 mm X 3.000 mm ]
#[ Coordinates Order   = RAI ]
# Mean and SEM based on absolute value of voxel intensities ]
#
#Volume  CM RL  CM AP  CM IS  minRL  maxRL  minAP  maxAP  minIS  maxIS    Mean     SEM    Max Int  MI RL  MI AP  MI IS
#------  -----  -----  -----  -----  -----  -----  -----  -----  -----  -------  -------  -------  -----  -----  -----
   6356   -3.8   64.6    5.1  -85.2   66.1  -23.8   94.5  -17.7   54.3   737.65   8.1391     6058   30.3   83.5   15.3
   3768    1.5   57.8   30.9  -38.4   63.3    9.2   89.0  -14.7   78.3    361.1   4.2248    -2484   -2.7   56.0   57.3
    409   -2.4  -75.6   21.1  -24.7   16.6  -92.5  -56.8   -2.7   54.3   261.74   6.1822     -893   -2.7  -70.5   -2.7
    364  -51.7  -24.4   52.7  -65.9  -35.7  -43.0  -10.0   30.3   78.3   445.96   17.761     2579  -41.2  -15.5   78.3
    360  -58.9   -3.2   38.9  -74.2  -35.7  -29.3   45.0   24.3   54.3   271.52   6.4048     -867  -68.7  -18.3   39.3
    306   45.1  -27.7   44.3   22.1   55.1  -43.0   -7.3   27.3   63.3   316.08   8.6493      925   49.6  -34.8   54.3
    271   30.4   33.5   57.7   16.6   60.6    3.7   50.5   39.3   72.3   309.33    14.78     1322   24.8   39.5   69.3
    242   50.7  -10.1   40.6   27.6   60.6  -26.5    3.7   21.3   63.3   317.03   11.226     -986   57.8  -18.3   39.3
    233   40.1  -51.9   28.7   24.8   57.8  -76.0  -34.8    9.3   54.3   250.69   7.3902      883   57.8  -37.5   12.3
#------  -----  -----  -----  -----  -----  -----  -----  -----  -----  -------  -------  -------  -----  -----  -----
# 12309   -2.5   54.3   14.1                                             546.91   4.8108
AFNI programs will be able to read just the numbers from this file,
using standard selectors like ‘[]’. One can also display just the
numbers with the following AFNI command: 1dcat Clust_report.1D or,
relatedly, 1dcat Clust_report.1D > Clust_report_numbers.1D
Finding ROI locations in atlases with “whereami”
AFNI’s whereami provides information with respect to atlases that
the user has on their system. One can provide either a single
coordinate set (e.g., a peak location or center of mass) or an entire
ROI, and find out its approximate overlap with atlas regions.
In the case of individual coordinates, “nearby” ROIs are also listed, because neither alignment nor atlas definition are perfect…
# ... and use the center of mass (CM) locations of clusters, as
# determined using the '[..]' selectors, for identification in loaded
# atlases with 'whereami'
whereami                                                              \
   -tab                                                               \
   -coord_file Clust_report.1D'[1,2,3]'                               \
   > Clust_whereami_CM.1D

# ... AND we could use the map of ROIs to find out locations, based on
# overlaps in loaded atlases, also with whereami
whereami                                                              \
   -omask Clust_map.nii.gz                                            \
   > Clust_whereami_olap.1D
